

عالمی بروکر ریگولیشن چیک کرنے والا ایپ
WikiFX
اردو
简体中文
繁體中文
English
Pусский
日本語
ภาษาไทย
Tiếng Việt
Bahasa Indonesia
Español
हिन्दी
Filippiiniläinen
Français
Deutsch
Português
Türkçe
한국어
العربية
اردو


DBG Markets: Market Report for July 28, 2026


خلاصہ۔:Tech Sector Enters Sell-Off Phase as Market Awaits Fed Nasdaq 100, JP225, Bitcoin Gold AnalysisGlobal financial markets entered a divergent path on Tuesday as “Super Central Bank Week” got underway.

Tech Sector Enters Sell-Off Phase as Market Awaits Fed
Nasdaq 100, JP225, Bitcoin & Gold Analysis
Global financial markets entered a divergent path on Tuesday as “Super Central Bank Week” got underway. The temporary pause in Middle East geopolitical strikes has deflated the previously priced-in war premium, helping ease immediate market fears.
Tech Sell-Off: AI Capex Doubts & Pre-FOMC Profit Locking
The ongoing tech sell-off is largely driven by mounting anxieties over AI capital expenditure (CapEx) alongside pre-FOMC profit locking. Investors are increasingly moving to secure gains ahead of Wednesday's Fed decision.
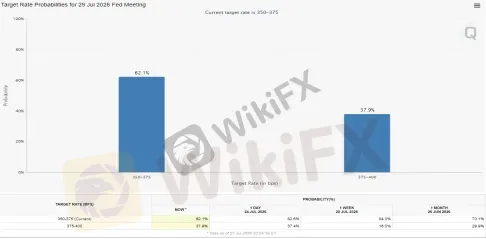
Fed Rate Futures Probabilities; Source: CME Group
Adding to the headwind, CME FedWatch pricing now reflects a 36.3% probability of a surprise Fed interest rate hike this week, up sharply from 16% last week. Consequently, broad equity markets are taking a defensive stance as traders position for upcoming post-FOMC volatility.
Technical Analysis & Key Levels
US Equities: Chip Sector Pressure & CapEx Scrutiny
Chip sector weakness and heavy scrutiny of AI infrastructure Capex remain the primary headwind risks for US equity benchmarks.
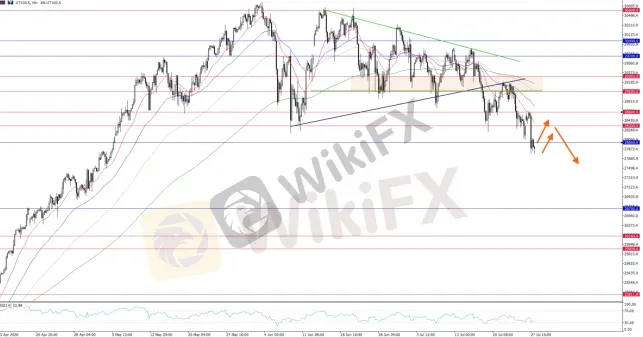
Nasdaq 100 (UT100), H4 Chart
The tech-heavy benchmark remains under technical pressure as covered earlier. A failure to reclaim the 29,000 psychological threshold and break out of the triangle pattern keeps the short-term chart structure tilted to the downside.
Near-term price action faces immediate overhead resistance, which has now shifted to 28,300 – 28,600. Primary support (now seemingly broken) rests at 28,000, which must hold to prevent a deeper technical breakdown amid Big Tech earnings releases and the Fed announcement.
Generally, the 28,000 – 28,600 region serves as a major resistance zone for the index. Until a strong footing forms here, the path of least resistance remains to the downside under these headwinds.
Japan Nikkei 225: Reversal Risk Extending to Downtrend
Tracking overnight weakness in US semiconductor stocks, Japan's Nikkei 225—which is also heavily weighted in AI and tech names—faces extended technical pressure.
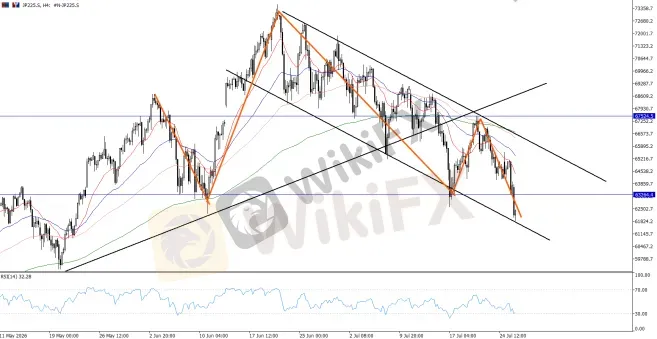
Nikkei 225 (JP225), H4 Chart
The recent technical reversal threatens to extend into a broader short-term downtrend. The breakdown below the recent trendline and the formation of a clear head-and-shoulders pattern have confirmed a bearish reversal.
Meanwhile, a near-term downtrend channel has formed, alongside a bearish crossover in moving averages, further supporting the bearish setup.
For now, a failure to hold above immediate structural support at 63,300 exposes the index to a deeper pullback toward the 59,000 – 60,000 region, as risk-off sentiment in the global tech supply chain weighs on Japanese tech exporters.
Bitcoin: Softening Sentiment Below $65,000
Apart from tech equities, crypto assets are facing renewed downward pressure as broader market sentiment sours and tech-related hype cools ahead of central bank decisions.
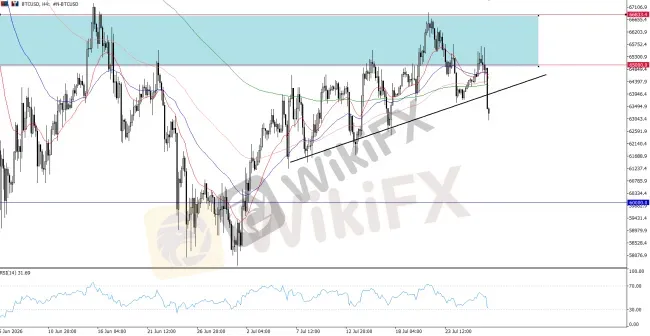
BTCUSD, H4 Chart
Bitcoin remains constrained beneath the $65,000 overhead resistance level. With tech sentiment cooling and rate hike bets creeping higher, a failure to break above $65,000 keeps the near-term bias tilted downward, leaving Bitcoin vulnerable to a retest of lower support near $61,000 – $60,000.
Gold Outlook: Consolidating Above $4,000 Baseline
Spot gold continues to consolidate as safe-haven demand from Middle East friction eases, while rising Treasury yields and Fed rate hike bets pressure prices.
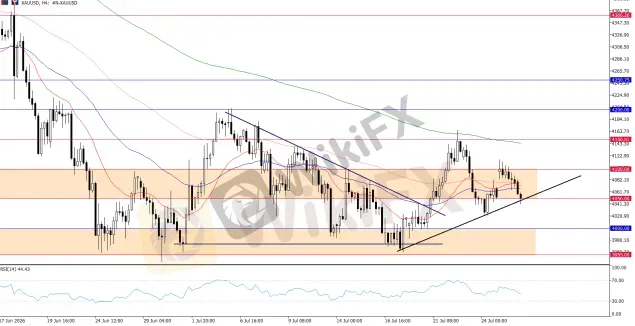
XAUUSD, H4 Chart
Technically, gold continues to defend its $4,000 macro support baseline, which we can temporarily set aside. Near-term price action is locked in a pivot range between $4,050 and $4,100.
A sustained hold above $4,050 keeps the broader structure stable, but a clean breakout above $4,100 is required to reactivate bullish momentum. On the downside, a break below $4,050 would signal another technical correction toward $3,950 – $4,000.
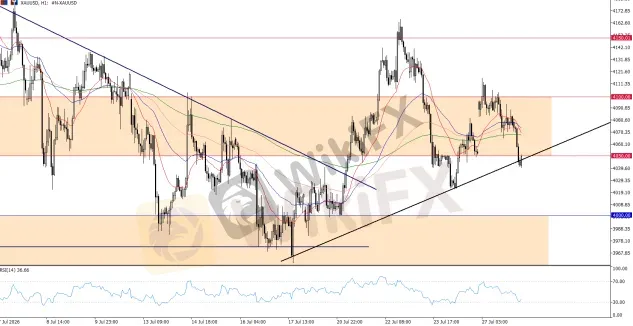
XAUUSD, H1 Chart
For intraday moves, expect continued consolidation if $4,050 holds, but remain open and cautious to any short-term move that breaks $4,050 support.
Bottom Line & Asset Summary
Global risk appetite is cooling as initial AI enthusiasm gives way to strict CapEx scrutiny and pre-FOMC profit taking. With CME FedWatch rate hike probabilities rising to 36.3%, tech stocks, Japanese equities, and crypto face near-term selling pressure, while gold consolidates above its $4,050 pivot level.
· Nasdaq 100 (UT100): Bearish Bias / Overhead Resistance; capped below 28,300 – 28,600 resistance zone, with 28,000 acting as critical downside support.
· Japan Nikkei 225 (JP225): Bearish Reversal / Head & Shoulders Confirmed; breakdown below 63,300 exposes the index to 59,000 – 60,000.
· Bitcoin (BTC/USD): Near-Term Downtrend; capped under $65,000 resistance, eyeing lower support at $61,000 – $60,000.
· Gold (XAU/USD): Intraday Consolidation / Range-Bound; holding firm above $4,050 support ($4,000 macro baseline), with $4,100 as key upside resistance.

ڈس کلیمر:
یہ مضمون صرف مصنف کی ذاتی رائے پر مبنی ہے، یہ پلیٹ فارم کی سرمایہ کاری کی مشورہ نہیں ہے۔ پلیٹ فارم مضمون کی معلومات کی درستگی، مکملیت اور بروقت ہونے کی کوئی ضمانت نہیں دیتا، اور مضمون کی معلومات پر اعتماد یا استعمال سے ہونے والے کسی بھی نقصان کی ذمہ داری قبول نہیں کرتا۔
