World Cup Fever Is Here! Choose your broker like you choose your team
Join WikiFX and investors worldwide in celebrating the excitement of the 2026 FIFA World Cup!
Original
简体中文
繁體中文
English
Pусский
日本語
ภาษาไทย
Tiếng Việt
Bahasa Indonesia
Español
हिन्दी
Filippiiniläinen
Français
Deutsch
Português
Türkçe
한국어
العربية
اردو

Abstract:Know how to identify support and resistance levels like a pro with expert tips, tools, and strategies for successful trading. Master chart analysis today!
.jpg")
Support and resistance levels are fundamental concepts in technical analysis, serving as essential tools for traders who aim to make well-informed decisions. Whether you are just starting out or have years of experience in trading, mastering these levels can significantly elevate your trading strategy. This comprehensive guide will take you through everything you need to know about identifying support and resistance levels like a professional trader.
 Contents
Support and resistance levels are critical price points on a chart where the forces of supply and demand intersect. These levels are pivotal in understanding market dynamics and predicting future price movements.
Understanding these levels is crucial for traders as they help predict potential price reversals and make more informed trading decisions. By recognizing where these levels lie, traders can better anticipate market behavior and adjust their strategies accordingly.
Support and resistance levels are indispensable in trading for several compelling reasons:
Spotting support and resistance levels requires a combination of technical skills and practice. Here are some effective methods to identify these levels:

Several technical tools can enhance the accuracy of identifying support and resistance levels:
Moving averages can indeed act as dynamic support and resistance levels. Heres how they function in this capacity:
By incorporating moving averages into their analysis, traders can gain a clearer picture of the market trend and identify potential support and resistance levels more effectively.
Volume is a critical indicator that confirms the strength of support and resistance levels:
By analyzing volume alongside support and resistance levels, traders can gauge the strength of these levels and make more informed trading decisions.
Trading breakouts at support and resistance levels can be highly profitable if executed correctly. Here are some strategies to consider:
Mastering the identification of support and resistance levels is a crucial skill for any trader. These levels provide valuable insights into market dynamics, helping traders predict price movements, manage risk, and make informed trading decisions. By utilizing a combination of technical analysis tools, such as historical price levels, moving averages, and volume analysis, traders can enhance their ability to spot these key levels accurately. Whether you are a novice or an experienced trader, understanding and incorporating support and resistance levels into your trading strategy is a vital step toward achieving success in the markets. With practice and keen observation, you can identify these levels like a pro and significantly improve your trading outcomes.

Disclaimer:
The views in this article only represent the author's personal views, and do not constitute investment advice on this platform. This platform does not guarantee the accuracy, completeness and timeliness of the information in the article, and will not be liable for any loss caused by the use of or reliance on the information in the article.

Join WikiFX and investors worldwide in celebrating the excitement of the 2026 FIFA World Cup!
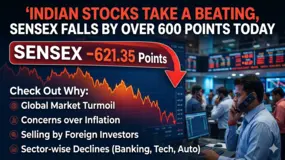
Indian stock markets witnessed a sharp low in the early trading hours on Monday. While the Sensex fell by more than 600 points, Nifty slumped under 23,200. The fall in the stock market today is the investors’ reaction to the escalating tensions in the Middle East, a surge in crude oil prices and weakness across markets worldwide. At around 9:30 a.m. on June 8, 2026, the BSE Sensex dropped by 627.47 points to 73,615.87, recording a fall of 0.85%. At the same time, the Nifty declined by 195.40 points to 23,171.30, registering a 0.84% fall. The selloff was broad based, with most sectoral indices slipping into red. Nifty IT, Nifty Realty, Nifty Auto and Nifty Metal slipped by 1.61%, 1.68%, 1.21% and 1.31%, respectively. Even the Nifty Midcap 100 and Nifty Smallcap 100 declined by 0.73% and 0.63%, respectively. As far as Sensex stocks are concerned, only State Bank of India, Axis Bank, Power Grid Corporation of India and Sun Pharmaceutical Industries were found to be green. Among the one
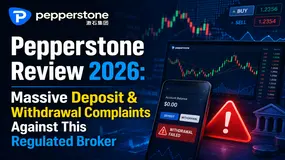
Have you experienced issues with Pepperstone deposit & withdrawal processing? From your experience, do you feel that the Australia-based forex broker causes losses to its clients? Did the brokerage entity freeze your account and give you a margin call? All these trading allegations have been rampant on broker review platforms such as WikiFX. This Pepperstone review article takes a close look at the user complaints, especially in 2026. Additionally, we have given an overview of the regulatory framework under which the brokerage entity operates.
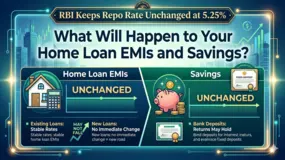
The Reserve Bank of India (RBI) decided to keep the repo rate unchanged at 5.25% in its monetary policy meeting on June 6, 226. The decision comes after the six-member monetary policy committee discussed the situation over days. The unanimous decision came hours after the US President Donald Trump decided a double-sided ceasefire with Iran. The global markets, including India, rallied after the US decision. The RBI governor-led monetary policy committee sits every two months to analyze key economic indicators and discuss the way forward through their policies.
 WikiFXWikiFXWikiFXWikiFXWikiFXWikiFXWikiFXWikiFXWikiFXWikiFX
