
Global Broker Regulation Inquiry App
WikiFX
English
简体中文
繁體中文
English
Pусский
日本語
ภาษาไทย
Tiếng Việt
Bahasa Indonesia
Español
हिन्दी
Filippiiniläinen
Français
Deutsch
Português
Türkçe
한국어
العربية
Gold Daily Chart Closes Strongly Higher – Bullish Bias in the Short Term
Abstract:Building on yesterdays commentary, we remain cautious on establishing a medium-term bullish outlook for gold given the current liquidity environment. However, since May, gold has been consolidating wi
Building on yesterdays commentary, we remain cautious on establishing a medium-term bullish outlook for gold given the current liquidity environment. However, since May, gold has been consolidating within a high-level range on the daily chart, which still leaves room for short-term tactical opportunities based on technical analysis.
Previously, our bearish framework for gold was based on expectations that a narrowing U.S. trade and current account deficit would lend support to the dollar. We also emphasized that investors should avoid turning overly bearish on the U.S. Dollar Index. Under conditions of a stronger dollar ahead, gold prices would likely remain under pressure.
That said, recent market developments have made it difficult for gold to establish clear downside momentum in the short run. From a macroeconomic perspective, golds short-term correlation with real purchasing power remains weak, and opportunities in non-U.S. currencies currently appear more cost-effective than in precious metals.
Investors should also note that Japans 10-year government bond yield has continued climbing to a 17-year high. This signals that markets are pricing in the Bank of Japan potentially restarting a tightening cycle. Any such rate hikes would tighten global liquidity and ripple through risk assets.
With the U.S.–Japan yield spread narrowing, USD/JPY faces structural downside pressure, limiting the scope for further yen depreciation. On an equity basis, the Nikkei 225 has indeed shown relative weakness compared with global peers.
Meanwhile, the softness in crude oil prices appears driven primarily by OPEC+ output increases rather than demand concerns. Historically, however, equity market pullbacks have often preceded sharp declines in oil prices due to recessionary fears. While global equity benchmarks remain elevated for now, we caution investors to watch for correction risks.
Sharp moves across equities, FX, and oil markets tend to spill over into precious metals. Past episodes such as the 2008, 2015, and 2018 oil collapses showed gold first declining before staging a recovery.
In periods of heightened market volatility, it is essential to anchor decisions in macroeconomic data while maintaining flexibility to pivot between long and short positions as trends evolve.
Gold Technical Outlook
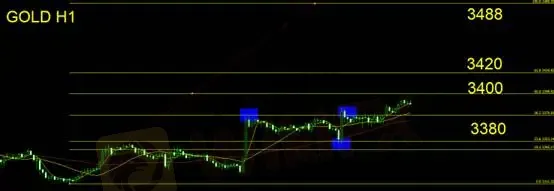
On the daily timeframe, gold confirmed a strong bullish close, setting a foundation for further short-term upside. Using Fibonacci extensions, the 1.618 wave projection on the hourly chart points to a near-term target of $3,420. A breakout above the current consolidation range could open the door toward the full Fibonacci target at $3,488.
For intraday trading, dips should be monitored for potential long entries. Key support sits at $3,380 – a successful retest could provide buying opportunities with a suggested stop loss of around $15.
Support: 3,380
Resistance: 3,400 / 3,420 / 3,488
Risk Disclaimer:
The above views, analyses, and price levels are provided solely for general market commentary. They do not represent the official stance of this platform. All readers are fully responsible for their own investment decisions. Please trade with caution.
Disclaimer:
The views in this article only represent the author's personal views, and do not constitute investment advice on this platform. This platform does not guarantee the accuracy, completeness and timeliness of the information in the article, and will not be liable for any loss caused by the use of or reliance on the information in the article.
WikiFX Broker
Latest News
Private payrolls rose 42,000 in October, more than expected and countering labor market fears, ADP says
 WikiFX
Yields Rise, Rate-Cut Odds Slide As ISM Services Survey Signal Inflation Fears
WikiFXOp-ed: The fuel for the AI boom driving the markets is advertising. It is also an existential risk.
WikiFXStonefort Broker Review 2025: Legit or Risky? A Complete Analysis
WikiFXThe United States Outgrows All Its Major Peers
WikiFXPINAKINE Broker India Review 2025: A Complete Guide to Safety and Services
WikiFXPINAKINE Broker Review: A Complete Look at Its Services and Risks
WikiFXVoices of the Golden Insight Award Jury - Simon So, Chief Experience Officer of Hantec Financial
WikiFXSeychelles FSA Flags Clone Website Impersonating Admiral Markets
WikiFXCanary Wharf Address Scam Resurfaces: FCA Exposes 20+ Clone Template Forex Platforms
WikiFXCurrency Calculator
USD

CNY
Current Rate: 0
Amount
USD
Available
CNY
Calculate