
Global Broker Regulation Inquiry App
WikiFX
English
简体中文
繁體中文
English
Pусский
日本語
ภาษาไทย
Tiếng Việt
Bahasa Indonesia
Español
हिन्दी
Filippiiniläinen
Français
Deutsch
Português
Türkçe
한국어
العربية
U.S. Equities Set for a Pullback in 2024 — Just as We Called for New Highs in April
Abstract:Equities remain buoyant, but the longer the rally extends, the more concerned we are about downside risks ahead.Back in April, when bearish sentiment was widespread, our call for new highs was rooted
Equities remain buoyant, but the longer the rally extends, the more concerned we are about downside risks ahead.
Back in April, when bearish sentiment was widespread, our call for new highs was rooted in valuations. At that time, the S&P 500s forward 12-month P/E ratio had fallen back to its 10-year average, making equities broadly attractive for medium- to long-term allocation.
Today, however, the forward P/E has climbed to 22.4 — its most expensive level since 2021. From a valuation perspective, the risk of a market pullback is increasingly difficult to ignore.
")
(Chart 1. S&P 500 Forward 12-Month P/E; Source: FactSet)Valuation Alone Doesnt Guarantee a Selloff
Elevated multiples can sometimes persist while corporate earnings catch up, leading to consolidation rather than a broad correction. Unfortunately, the underlying U.S. economic structure suggests this cycle may not play out so benignly.
1. Weak Domestic Demand and Rising Unemployment
U.S. consumption relies heavily on steady income and the wealth effect, which is why employment data is critical.
A closer look at unemployment duration shows concerning trends: the number of workers unemployed for less than 5 weeks and over 15 weeks has reached a three-year high. While the 5–14 week category has declined slightly, last weeks non-farm payrolls showed all three segments rising together — a clear headwind for household spending.
")
(Chart 2. Unemployment Duration; Source: MacroMicro)2. Why Weak Consumption Matters — Isnt AI Enough to Prop Things Up?
Consumer weakness affects more than just discretionary and staples, which together account for 15–17% of S&P 500 market cap.
Directly Exposed: Consumer Discretionary & Consumer Staples → 15–17% weight
Highly Correlated: Communication Services, Financials, Real Estate → ~20% weight
Indirectly Affected: Industrials, Energy, parts of Tech → spillover impact
In total, at least 5–6 major sectors, representing 35–40% of S&P 500 capitalization, are at risk. With transmission effects, over half the index could ultimately be impacted.
While large-cap blue chips continue to fuel index gains with aggressive capex, the “hollow core” of U.S. growth will eventually show up in broader index performance.
We expect risk assets to correct more broadly in the months ahead. Our outlook for gold will follow in the next commentary.
Gold Technical Outlook
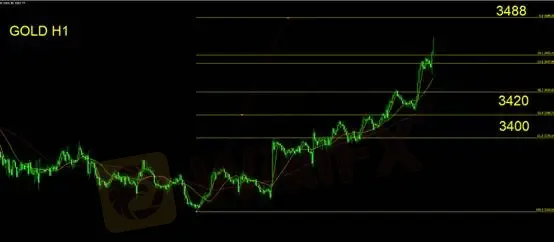
Based on Fibonacci extension levels, golds upside projection sits at $3,488. However, we believe prices have already entered overbought territory.
Support: $3,420 / $3,400
Resistance: $3,488
Trading guidance:
Long positions should trail stops higher.
If support breaks, it signals trend reversal.
Resistance is not necessarily a hard ceiling in a bullish trend.
Flat traders should remain on the sidelines; shorts should exit quickly.
Risk Disclaimer: The views, analysis, research, prices, or other information herein are provided as general market commentary and do not constitute investment advice. All readers assume full responsibility for their trading decisions.
Disclaimer:
The views in this article only represent the author's personal views, and do not constitute investment advice on this platform. This platform does not guarantee the accuracy, completeness and timeliness of the information in the article, and will not be liable for any loss caused by the use of or reliance on the information in the article.
WikiFX Broker
Latest News
Op-ed: The fuel for the AI boom driving the markets is advertising. It is also an existential risk.
 WikiFX
PINAKINE Broker India Review 2025: A Complete Guide to Safety and Services
WikiFXThe United States Outgrows All Its Major Peers
WikiFXCanary Wharf Address Scam Resurfaces: FCA Exposes 20+ Clone Template Forex Platforms
WikiFXSeychelles FSA Flags Clone Website Impersonating Admiral Markets
WikiFXVoices of the Golden Insight Award Jury - Simon So, Chief Experience Officer of Hantec Financial
WikiFXPINAKINE Broker Review: A Complete Look at Its Services and Risks
WikiFXPrivate payrolls rose 42,000 in October, more than expected and countering labor market fears, ADP says
WikiFXHe Thought It Was a Crypto Investment; It Cost Him RM1.2 Million
WikiFXYields Rise, Rate-Cut Odds Slide As ISM Services Survey Signal Inflation Fears
WikiFXCurrency Calculator
USD

CNY
Current Rate: 0
Amount
USD
Available
CNY
Calculate