

Global Broker Regulation Inquiry App
About WikiFX
English
简体中文
繁體中文
English
Pусский
日本語
ภาษาไทย
Tiếng Việt
Bahasa Indonesia
Español
हिन्दी
Filippiiniläinen
Français
Deutsch
Português
Türkçe
한국어
العربية
اردو
These Are Europe's Top Economies By Projected 2026 GDP
Abstract:After two years of sluggish activity, Europes economic engine is forecast to regain traction.As Visu
After two years of sluggish activity, Europes economic engine is forecast to regain traction.
As Visual Capitalist's Pallavi Rao shows in the chart below, The International Monetary Fund‘s (IMF) latest World Economic Outlook projects that the region’s combined output will reach $31.4 trillion(€27.0 trillion) in 2026, with the biggest gains concentrated in Western Europe.
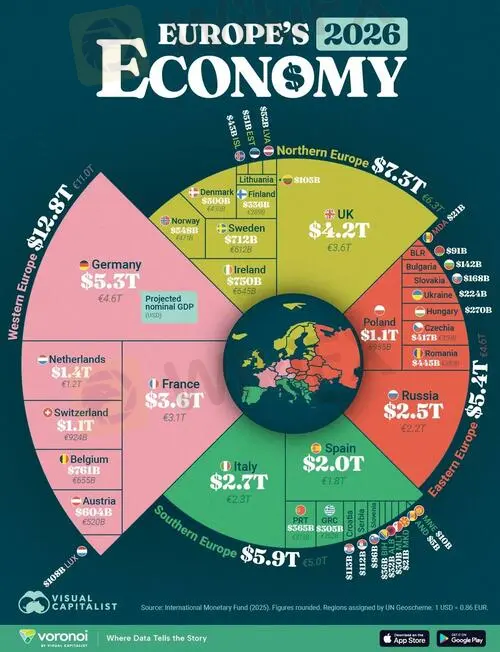
Germany Leads Europes Largest Economies
Germany is expected to reclaim momentum, adding almost $400 billion to its economy between 2024 and 2026.
At $5.3 trillion, it will account for roughly 17% of all European GDP.
| Rank | European Country | ISO Code | 2026 GDP (billions USD) | Readable Label (USD) | Readable Label (EUR) |
|---|---|---|---|---|---|
| 1 | 🇩🇪 Germany | DEU | $5,328 | $5.3T | €4.6T |
| 2 | 🇬🇧 UK | GBR | $4,226 | $4.2T | €3.6T |
| 3 | 🇫🇷 France | FRA | $3,559 | $3.6T | €3.1T |
| 4 | 🇮🇹 Italy | ITA | $2,702 | $2.7T | €2.3T |
| 5 | 🇷🇺 Russia | RUS | $2,509 | $2.5T | €2.2T |
| 6 | 🇪🇸 Spain | ESP | $2,042 | $2.0T | €1.8T |
| 7 | 🇳🇱 Netherlands | NLD | $1,413 | $1.4T | €1.2T |
| 8 | 🇵🇱 Poland | POL | $1,110 | $1.1T | €955B |
| 9 | 🇨🇭 Switzerland | CHE | $1,075 | $1.1T | €924B |
| 10 | 🇧🇪 Belgium | BEL | $761 | $761B | €655B |
| 11 | 🇮🇪 Ireland | IRL | $750 | $750B | €645B |
| 12 | 🇸🇪 Sweden | SWE | $712 | $712B | €612B |
| 13 | 🇦🇹 Austria | AUT | $604 | $604B | €520B |
| 14 | 🇳🇴 Norway | NOR | $548 | $548B | €471B |
| 15 | 🇩🇰 Denmark | DNK | $500 | $500B | €430B |
| 16 | 🇷🇴 Romania | ROU | $445 | $445B | €383B |
| 17 | 🇨🇿 Czechia | CZE | $417 | $417B | €359B |
| 18 | 🇵🇹 Portugal | PRT | $365 | $365B | €313B |
| 19 | 🇫🇮 Finland | FIN | $336 | $336B | €289B |
| 20 | 🇬🇷 Greece | GRC | $305 | $305B | €262B |
| 21 | 🇭🇺 Hungary | HUN | $270 | $270B | €232B |
| 22 | 🇺🇦 Ukraine | UKR | $224 | $224B | €193B |
| 23 | 🇸🇰 Slovakia | SVK | $168 | $168B | €144B |
| 24 | 🇧🇬 Bulgaria | BGR | $142 | $142B | €122B |
| 25 | 🇭🇷 Croatia | HRV | $113 | $113B | €97B |
| 26 | 🇷🇸 Serbia | SRB | $112 | $112B | €96B |
| 27 | 🇱🇺 Luxembourg | LUX | $108 | $108B | €93B |
| 28 | 🇱🇹 Lithuania | LTU | $105 | $105B | €90B |
| 29 | 🇧🇾 Belarus | BLR | $91 | $91B | €78B |
| 30 | 🇸🇮 Slovenia | SVN | $86 | $86B | €74B |
| 31 | 🇱🇻 Latvia | LVA | $52 | $52B | €45B |
| 32 | 🇪🇪 Estonia | EST | $51 | $51B | €44B |
| 33 | 🇮🇸 Iceland | ISL | $43 | $43B | €37B |
| 34 | 🇧🇦 Bosnia & Herzegovina | BIH | $36 | $36B | €31B |
| 35 | 🇦🇱 Albania | ALB | $32 | $32B | €28B |
| 36 | 🇲🇹 Malta | MLT | $30 | $30B | €26B |
| 37 | 🇲🇩 Moldova | MDA | $21 | $21B | €18B |
| 38 | 🇲🇰 North Macedonia | MKD | $21 | $21B | €18B |
| 39 | 🇲🇪 Montenegro | MNE | $10 | $10B | €9B |
| 40 | 🇦🇩 Andorra | AND | $5 | $5B | €4B |
| 41 | 🇸🇲 San Marino | SMR | $2 | $2B | €2B |
| N/A | 🇪🇺 Western Europe | W EUR | $12,848 | $12.8T | €11.0T |
| N/A | 🇪🇺 Northern Europe | N EUR | $7,322 | $7.3T | €6.3T |
| N/A | 🇪🇺 Southern Europe Europe | S EUR | $5,861 | $5.9T | €5.0T |
| N/A | 🇪🇺 Eastern Europe | E EUR | $5,397 | $5.4T | €4.6T |
| N/A | 🇪🇺 Europe | EUR | $31,427 | $31.4T | €27.0T |
Close behind, the U.K.and Franceare projected at $4.2 trillion and $3.6 trillion, respectively.
Together, the trio will generate over 40% of Europes total economic activity. This underscores how the big markets dominate the regional picture.
ℹ️ Related: In fact, the German economy is as big as the entire Eastern European economy ($5.4T).
Southern and Eastern Europe Show Diverging Paths
The continent can effectively be divided into two halves: the Northern and Western half and the Southern and Eastern half.
Italyand Spain, Southern Europes heavyweights, are on course for modest expansion, at $2.7 trillion and $1.8 trillion in 2026.
| Rank | European Region | 2026 GDP (billions USD) | Readable Label (USD) | Readable Label (EUR) |
|---|---|---|---|---|
| 1 | 🇪🇺 Western Europe | $12,848 | $12.8T | €11.0T |
| 2 | 🇪🇺 Northern Europe | $7,322 | $7.3T | €6.3T |
| 3 | 🇪🇺 Southern Europe Europe | $5,861 | $5.9T | €5.0T |
| 4 | 🇪🇺 Eastern Europe | $5,397 | $5.4T | €4.6T |
| N/A | 🇪🇺 Europe | $31,427 | $31.4T | €27.0T |
In Eastern Europe, Russiais projected at $2.5 trillion, aided by energy exports, while Polandbreaks into the continental top 10 at $1.1 trillion.
However, despite a decade of super-charged growth that has lifted real GDP per capita in the East, theres still a ways to go to close the income gap with the West.
ℹ️ Related: Take a look at where living standards have grown the most in Europe in the last decade.
Europes Economic Outlook for 2026
The IMF has good and bad news for Europe.
The good news is that the pandemic and energy shocks have passed and the continent is officially in recovery mode thanks to “good policy decisions.”
This had led to higher real wages that have boosted consumption, particularly in Germany, the largest economy.
The bad news is that Donald Trumps trade war is causing uncertainty and will shave off 0.5% of growth, which will be somewhat offset by higher infrastructure and defense spending.
However, in turn this higher government spending is coming at the expense of debt.
Disclaimer:
The views in this article only represent the author's personal views, and do not constitute investment advice on this platform. This platform does not guarantee the accuracy, completeness and timeliness of the information in the article, and will not be liable for any loss caused by the use of or reliance on the information in the article.
WikiFX Broker
Latest News
WHITEFOREX Review 2026: I Am Not the Only Victim of Its Profit Seizure Activity; Users Say This!
 WikiFX
Vonway Forex Review: No Regulation, Withdrawal Complaints, and a Broker Warning
WikiFXFinalto Review 2026: Regulation, Trading Environment, and Platform Access Risks
WikiFXReview 2026: TRADING 212 Regulation, Clone Warning, and Withdrawal Complaint
WikiFXReview 2026: BOLD PRIME Complaints, Regulation Warnings, and Withdrawal Risk
WikiFXReview 2026: EMIRAX MARKETS Regulation, Withdrawal Complaints, and Trading Risks
WikiFXPolymarket Under Fire as Wall Street Watchdog Launches Investigation
WikiFXEMAR MARKETS Review 2026: No Withdrawals Despite Millions Paid in Verification Fees
WikiFXUS-Iran Tension Rattles Indian Stock Markets Today; Still Some Gained in a Gloomy Scenario
WikiFXFinal Hours for OneCoin Victims: Billions Lost as DOJ Compensation Deadline Looms
WikiFXCurrency Calculator
USD

CNY
Current Rate:0
Enter amount
USD
Redeemable Amount
CNY
Calculate 