
Applicazione di richiesta di informazioni sulla regolamentazione dei broker globali
WikiFX
English
简体中文
繁體中文
English
Pусский
日本語
ภาษาไทย
Tiếng Việt
Bahasa Indonesia
Español
हिन्दी
Filippiiniläinen
Français
Deutsch
Português
Türkçe
한국어
العربية
FPG BTCUSD Market Report September 29, 2025
Sommario:Bitcoin (BTCUSD) on the H4 chart is currently attempting a breakout from its consolidation phase, as seen in the highlighted green box. Price action has been supported near the 108,600 level, while re
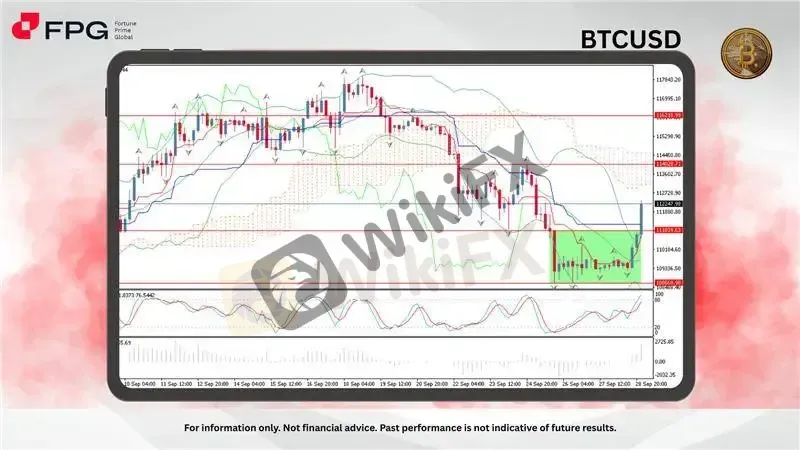
Bitcoin (BTCUSD) on the H4 chart is currently attempting a breakout from its consolidation phase, as seen in the highlighted green box. Price action has been supported near the 108,600 level, while repeatedly testing resistance around 111,000. The strong bullish candle breaking above the consolidation range suggests renewed momentum, with the next resistance seen at 114,030. If this momentum sustains, buyers may eye the upper resistance zone near 116,200.
The Ichimoku Cloud setup still reflects an overall bearish bias, as the price remains below the Kumo and the Senkou Span A/B levels point downward. However, the Tenkan-sen (red) and Kijun-sen (blue) lines are beginning to flatten, which could indicate potential short-term stabilization. The Chikou Span (green line) still trails below price and cloud, reinforcing that the medium-term trend remains bearish unless a decisive breakout above the cloud occurs.
Momentum indicators show overbought conditions. The Stochastic oscillator is above 90, signaling that price may face pullback pressure in the short term. Meanwhile, bullish volume has picked up, confirming the strength of the current upward push. Traders should watch closely for whether BTC can hold above 111,000; failure to sustain this breakout could trigger a retracement toward 109,300. A successful continuation above 112,250 would strengthen bullish sentiment and potentially shift the broader outlook toward recovery.
Market Observation & Strategy Advice:
1. Current Position: BTCUSD is around 112,250 after consolidating, showing short-term bullish momentum while still under pressure from the Ichimoku cloud.
2. Resistance Zone: Key resistance at 114,030, with a stronger ceiling near 116,200.
3. Support Zone: Immediate support at 111,000, with stronger levels at 109,300 and 108,600.
4. Indicators: The Ichimoku setup still leans bearish overall, though the flattening Tenkan-sen and Kijun-sen suggest some stabilization. The Stochastic oscillator is in overbought territory above 90, hinting at possible short-term pullback pressure. Meanwhile, rising bullish volume supports the breakout attempt, indicating that buyers remain active despite overextended momentum signals.
5. Trading Strategy Suggestions:
Upside Bias: A sustained move above 112,250 opens the path toward 114,030, with potential extension to 116,200.
Pullback Setup: If price fails to hold above 112,250, watch for buying opportunities at 111,000 or deeper around 109,300–108,600.
Risk Management: Momentum is overbought, so keep positions light and use tight stop-loss levels to protect against sharp reversals.
Market Performance:
Crypto Last Price % Change
ETHUSD 4,125.2 −0.47%
LTCUSD 106.88 −0.02%
Today's Key Economic Calendar:
US: Fed Waller Speech
US: Pending Home Sales MoM & YoY
US: Dallas Fed Manufacturing Index
Risk Disclaimer This report is for informational purposes only and does not constitute financial advice. Investments involve risks, and past performance does not guarantee future results. Consult your financial advisor for personalized investment strategies.
Disclaimer:
Le opinioni di questo articolo rappresentano solo le opinioni personali dell’autore e non costituiscono consulenza in materia di investimenti per questa piattaforma. La piattaforma non garantisce l’accuratezza, la completezza e la tempestività delle informazioni relative all’articolo, né è responsabile delle perdite causate dall’uso o dall’affidamento delle informazioni relative all’articolo.
WikiFX Trader
TMGM
Sotto supervisione
XM
Sotto supervisione
FXCM
Sotto supervisione
STARTRADER
Sotto supervisione
Exness
Sotto supervisione
D prime
Sotto supervisione
TMGM
Sotto supervisione
XM
Sotto supervisione
FXCM
Sotto supervisione
STARTRADER
Sotto supervisione
Exness
Sotto supervisione
D prime
Sotto supervisione
Rate Calc
USD

CNY
Tasso di cambio attuale: 0
inserisci l'importo
USD
A disposizione
CNY
Calcolare