
Applicazione di richiesta di informazioni sulla regolamentazione dei broker globali
WikiFX
English
简体中文
繁體中文
English
Pусский
日本語
ภาษาไทย
Tiếng Việt
Bahasa Indonesia
Español
हिन्दी
Filippiiniläinen
Français
Deutsch
Português
Türkçe
한국어
العربية
What does a trading signal look like? - Week 39 | Technical Analysis by Jasper Lawler
Sommario:Weekly thoughtsWhat does a trading signal look like?And I‘m not talking about the ’buy/sell signals you get asked to pay for on Telegram!I mean what does it look like when the market signals to you th
Weekly thoughts
What does a trading signal look like?
And I‘m not talking about the ’buy/sell signals you get asked to pay for on Telegram!
I mean what does it look like when the market signals to you that there is a trade you can place to earn a potential profit?
Of course, it can look a million different ways but there are some common components to all trading signals.
I show you what we are looking for every week in our setups and signals. And hopefully that serves as some good inspiration.
But ultimately, you need to know what youre looking for.
Think of the signal as the bridge between the idea (setup) and the execution (trigger).
Setup = Why → The context. Whats going on? What trade idea makes sense?
Signal = When → The market condition that validates your idea.
Trigger = How → The precise entry tactic you use once the signal has flashed.
Components of a Good Signal
1. In alignment with Setup
The signal should directly tie back to your scenario.
Setup: Pullback in an uptrend, want to buy dip
Signal: Price touches 50-day MA + prints bullish pin bar
2. Objective & Repeatable
A signal is not a feeling. Its something you can write down and backtest.
“Price looks like its too high” = vague
“Daily close above prior resistance, making a new 20-day high” = testable
3. Condition-based, Not Action-based
This is where it's easy to conflate a signal with a trigger. A signal is not “I enter on candle close” (thats the trigger). The signal is: “A candle closes above resistance.”
4. Often Multi-layered (Confluence)
Most strong signals involve more than one confirming condition:
A level (support/resistance, supply/demand)
A price action pattern (inside bar, engulfing, pin bar, breakout)
A filter/indicator (MA, RSI, VWAP, volume, volatility)
Breakout signal → invalid if price falls back inside the range
Reversal signal → invalid if price closes beyond the support/resistance zone
Examples of Signals
Reversal setup:
Signal = Price enters a demand zone and prints a bullish engulfing candle.
Breakout setup:
Signal = A 4H candle closes above the consolidation range with above-average volume.
Trend continuation setup:
Signal = Price pulls back to the 20 EMA and forms an inside bar that breaks upward.
Above Ive given some brief examples for educational purposes but any trading signal must be much more detailed to be able to trade it. But worry not!
In future weeks we will give more detailed examples of trading signals, as well as triggers and setups - that you can test out and see what works for you.
Setups & signals
We look at hundreds of charts each week and present you with three of our favourite setups and signals.
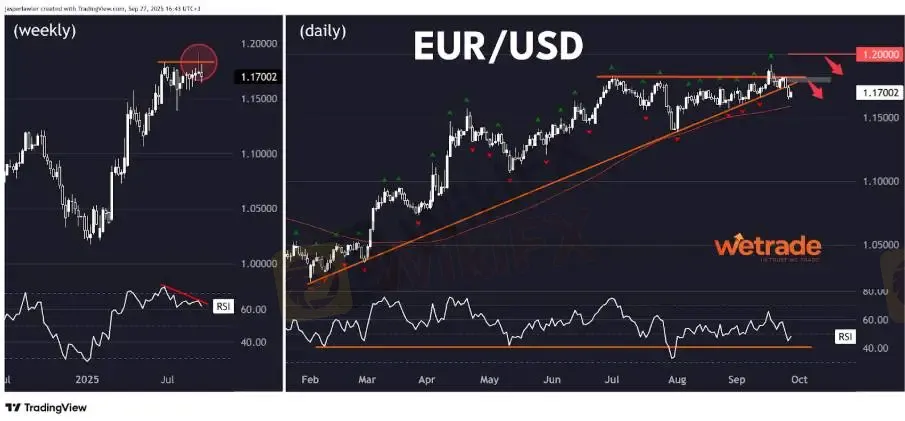
EUR/USDSetup
Likely market top and possible trend reversal. A shooting star candle pattern produced a fakeout above the prior highs alongside bearish RSI divergence, with price again unable to reach the 1.20 round number.
Signal
A broken long term uptrend line as well as RSI shifting to a bearish regime holding under the 65 level suggests the uptrend has begun to reverse. A supply zone around 1.18 could offer a sell signal, as could the 1.20 figure if the market puts in one more ‘failed’ higher high.
Signal
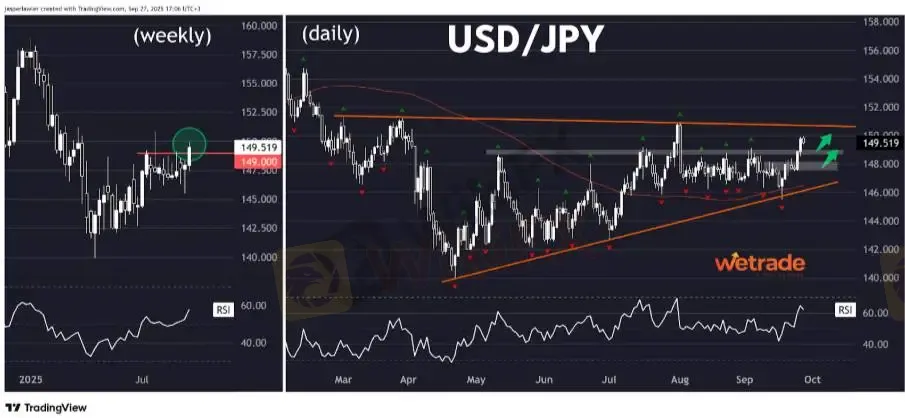
USD/JPYSetup
Signal
The more conditions that line up, the “louder” the signal.
5. Clear Invalidity
Every signal should imply a point where its no longer valid.
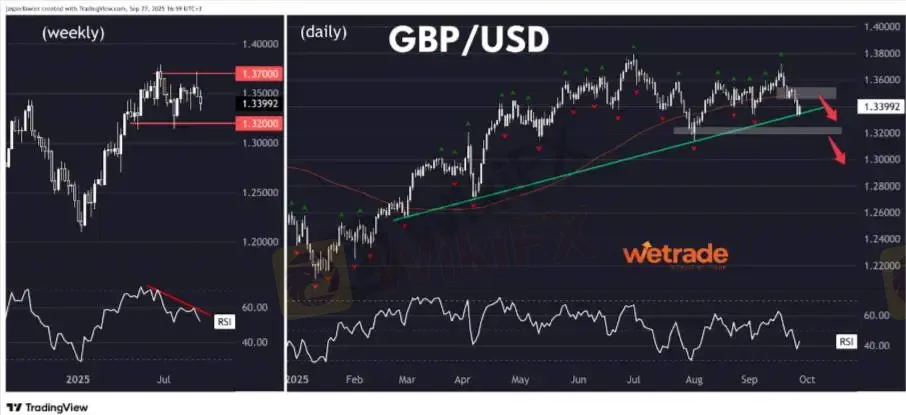
GBP/USD
SetupThe uptrend has already turned into a sideways range between around 1.32 and 1.37 setting up a possible market top and new downtrend.
RSI already reached oversold levels in early August and has failed to get overbought since, while price has failed several attempts to break and hold above 1.36. A bounce towards the supply zone around 1.35 could present a sell trigger while a break of the uptrend line would confirm the bearish reversal.
The price just made its highest weekly close since March, signalling a likely market bottom and new uptrend.
Price has held above its 100-day MA and support at the 146 level - hitting 150 last week. Another pullback to 149 or 148 could offer a buy trigger with a break of the long term triangle patterns upper trendline confirming the bullish reversal.
But - as always - thats just how the team and I are seeing things, what do you think?
Disclaimer:
Le opinioni di questo articolo rappresentano solo le opinioni personali dell’autore e non costituiscono consulenza in materia di investimenti per questa piattaforma. La piattaforma non garantisce l’accuratezza, la completezza e la tempestività delle informazioni relative all’articolo, né è responsabile delle perdite causate dall’uso o dall’affidamento delle informazioni relative all’articolo.
WikiFX Trader
FXTM
Sotto supervisione
Plus500
Sotto supervisione
STARTRADER
Sotto supervisione
GTCFX
Sotto supervisione
Exness
Sotto supervisione
FXCM
Sotto supervisione
FXTM
Sotto supervisione
Plus500
Sotto supervisione
STARTRADER
Sotto supervisione
GTCFX
Sotto supervisione
Exness
Sotto supervisione
FXCM
Sotto supervisione
Rate Calc
USD

CNY
Tasso di cambio attuale: 0
inserisci l'importo
USD
A disposizione
CNY
Calcolare