
Applicazione di richiesta di informazioni sulla regolamentazione dei broker globali
WikiFX
English
简体中文
繁體中文
English
Pусский
日本語
ภาษาไทย
Tiếng Việt
Bahasa Indonesia
Español
हिन्दी
Filippiiniläinen
Français
Deutsch
Português
Türkçe
한국어
العربية
FPG XAUUSD Market Report October 17, 2025
Sommario:As expected, gold has once again reached a new all-time high, touching 4380 before experiencing a minor correction to around 4363. The bullish momentum remains strong and consistent, supported by a cl
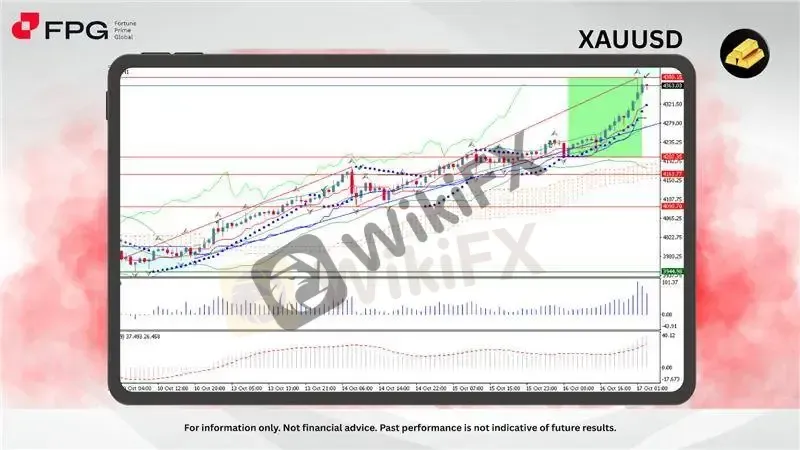
As expected, gold has once again reached a new all-time high, touching 4380 before experiencing a minor correction to around 4363. The bullish momentum remains strong and consistent, supported by a clear upward structure on the H1 timeframe. The recent sequence of long bullish candles confirms that buyers continue to dominate the market. This trend, which has persisted for several weeks, shows no significant signs of exhaustion, suggesting that gold may soon attempt to form another record high in the near future.
From a technical perspective, the price remains comfortably above the Ichimoku cloud, reinforcing the ongoing bullish bias. The Parabolic SAR continues to print below price, aligning with a strong upward trend confirmation. Both the moving averages and Bollinger Bands indicate sustained momentum, with price hugging the upper band—typically a signal of aggressive buying. Meanwhile, the MACD histogram is expanding positively, reflecting increasing bullish pressure, while the Bulls Power indicator confirms buyers dominance. Short-term corrections may occur, but the structure strongly supports continued upward movement unless a sharp reversal breaks below the 4320–4300 zone.
Fundamentally, gold‘s strength is underpinned by a combination of macroeconomic and geopolitical factors. The ongoing uncertainty surrounding the U.S. Federal Reserve’s rate stance continues to support demand for safe-haven assets, as investors anticipate a slower pace of tightening or potential rate cuts ahead. Additionally, geopolitical tensions—particularly in the Middle East and the rising political friction involving China—have further fueled gold‘s appeal as a global hedge. This convergence of monetary and geopolitical pressures continues to provide strong tailwinds for gold’s bullish trajectory.
Market Observation & Strategy Advice
1. Current Position: Gold is currently trading around 4363, after reaching a new all-time high at 4380 earlier today. Despite the minor pullback, overall sentiment remains bullish, supported by strong momentum and consistent higher highs across recent sessions.
2. Resistance Zone: The immediate resistance lies at 4380, marking the latest peak and potential short-term ceiling. A sustained breakout above this level could open the path toward the 4400–4420 range as the next bullish target zone.
3. Support Zone: The nearest support levels are observed at 4320 and 4300, followed by a stronger base around 4200. As long as price remains above these zones, the broader uptrend structure stays intact.
4. Indicators: Technical indicators continue to signal a strong bullish bias. The Parabolic SAR dots remain below the price, affirming the ongoing upward trend. The Ichimoku Cloud provides solid support beneath the price action, while the MACD shows widening histogram bars, reflecting strong momentum. Meanwhile, the Bulls Power indicator confirms that buying pressure remains dominant. Short-term corrections may occur, but overall momentum still favors further upside continuation.
5. Trading Strategy Suggestions:
Buy on Dips: Look for long entries near the 4320–4300 support area, aligning with the lower boundary of the channel and the 20-period EMA for optimal risk-to-reward.
Target Breakout Levels: If price breaks and sustains above 4380, consider adding positions targeting 4400–4420 with tight trailing stops to lock in profits.
Risk Management: Set stop-loss orders below 4280 to protect against sudden reversals, especially ahead of high-impact news from the Federal Reserve or geopolitical developments.
Market Performance:
Precious Metals Last Price % Change
XPTUSD 1,727.64 −0.10%
XAGUSD 53.9868 −0.47%
Today's Key Economic Calendar:
UK: BoE Pill Speech
US: Building Permits Prel
US: Housing Starts
US: Fed Musalem Speech
Risk Disclaimer This report is for informational purposes only and does not constitute financial advice. Investments involve risks, and past performance does not guarantee future results. Consult your financial advisor for personalized investment strategies.
Disclaimer:
Le opinioni di questo articolo rappresentano solo le opinioni personali dell’autore e non costituiscono consulenza in materia di investimenti per questa piattaforma. La piattaforma non garantisce l’accuratezza, la completezza e la tempestività delle informazioni relative all’articolo, né è responsabile delle perdite causate dall’uso o dall’affidamento delle informazioni relative all’articolo.
WikiFX Trader
VT Markets
Sotto supervisione
EBC
Sotto supervisione
XM
Sotto supervisione
GTCFX
Sotto supervisione
D prime
Supervisione del paese
FOREX.com
Supervisione del paese
VT Markets
Sotto supervisione
EBC
Sotto supervisione
XM
Sotto supervisione
GTCFX
Sotto supervisione
D prime
Supervisione del paese
FOREX.com
Supervisione del paese
Rate Calc
USD

CNY
Tasso di cambio attuale:0
inserisci l'importo
USD
A disposizione
CNY
Calcolare