
Applicazione di richiesta di informazioni sulla regolamentazione dei broker globali
WikiFX
English
简体中文
繁體中文
English
Pусский
日本語
ภาษาไทย
Tiếng Việt
Bahasa Indonesia
Español
हिन्दी
Filippiiniläinen
Français
Deutsch
Português
Türkçe
한국어
العربية
FPG XAUUSD Market Report October 20, 2025
Sommario:Gold‘s opening this week shows a slowdown in momentum compared to previous weeks. On the H1 timeframe, the price experienced multiple rejections at the all-time high level of 4380, leading to a sharp
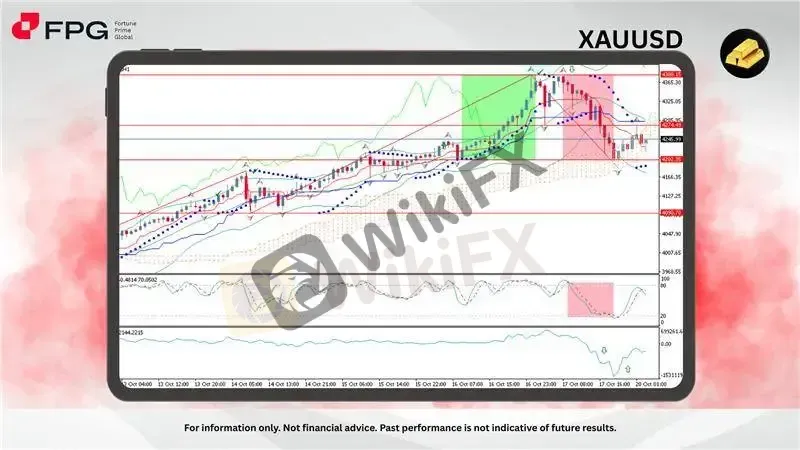
Gold‘s opening this week shows a slowdown in momentum compared to previous weeks. On the H1 timeframe, the price experienced multiple rejections at the all-time high level of 4380, leading to a sharp correction down to 4202. After finding support at that level, gold rebounded and is currently stabilizing around 4245, with interim resistance seen near 4274. The price is still showing mixed momentum, suggesting a possible consolidation phase before the next directional move. Traders should remain cautious ahead of today’s economic data, which could trigger renewed volatility.
Technically, the uptrend channel remains intact despite the correction. The price has pulled back toward the Ichimoku cloud, showing temporary weakness but maintaining structure above key support zones. The Stochastic oscillator is recovering from the oversold area, indicating that short-term bullish momentum may re-emerge if gold can hold above 4220. Parabolic SAR dots have recently flipped above the candles, signaling that the market is still in a corrective phase, while Bollinger Bands have started to narrow, often a precursor to a breakout.
Fundamentally, gold‘s movement continues to be influenced by uncertainty surrounding the U.S. Federal Reserve’s monetary policy stance, as investors await clarity on future interest rate paths.These combined factors suggest that gold remains in a long-term bullish environment, though short-term pullbacks are likely as traders react to U.S. data and geopolitical developments.
Market Observation & Strategy Advice
1. Current Position: Gold is currently trading around 4245, following a retracement from last weeks all-time high at 4380. The market remains in a broader bullish structure but is undergoing a short-term correction as momentum cools off. The recent rebound from the 4200 area suggests buyers are still active, though sentiment appears cautious ahead of key economic releases.
2. Resistance Zone: Immediate resistance is seen at 4274, followed by the 4335–4380 range, where multiple rejections occurred last week. A sustained break above 4274 could open the way for a retest of 4380 and potentially form a new high if bullish momentum returns.
3. Support Zone: Initial support lies at 4220–4200, aligned with the lower Bollinger Band and Ichimoku baseline. A deeper pullback could test 4163, which aligns with the previous consolidation zone and serves as a strong psychological level for buyers to defend.
4. Indicators: Technical indicators suggest mixed signals. The Stochastic oscillator has bounced from the oversold zone, indicating possible short-term upward movement. Parabolic SAR dots above price action reflect that the correction phase is still ongoing. Bollinger Bands are narrowing, signaling a potential volatility buildup before the next breakout. The Ichimoku cloud remains below price, confirming that the long-term trend bias is still bullish, though near-term movements may remain choppy.
5. Trading Strategy Suggestions:
Buy on Dips: Consider entering long positions near the 4220–4200 support zone if bullish signals (e.g., bullish candlestick patterns or Stochastic crossover) appear. Target the 4274 level initially, with a possible extension to 4335–4380 if momentum strengthens.
Wait for Breakout Confirmation: For conservative traders, wait for a confirmed breakout above 4274 with strong volume before entering new buy positions. This would signal renewed bullish momentum and potential continuation toward new all-time highs.
Short-term Caution: Avoid aggressive buying if the price breaks below 4200, as this could trigger a deeper correction toward 4163 or lower. In that case, look for stabilization before reentering long positions. Keep stops tight and monitor todays key economic data releases closely, as they may increase short-term volatility.
Market Performance:
Precious Metals Last Price % Change
XPTUSD 1,585.97 −1.38%
XAGUSD 51.7136 −0.39%
Today's Key Economic Calendar:
CN: GDP Growth Rate QoQ & YoY
CN: Industrial Production YoY
CN: Retail Sales YoY
JP: BoJ Takata Speech
DE: PPI MoM & YoY
Risk Disclaimer This report is for informational purposes only and does not constitute financial advice. Investments involve risks, and past performance does not guarantee future results. Consult your financial advisor for personalized investment strategies.
Disclaimer:
Le opinioni di questo articolo rappresentano solo le opinioni personali dell’autore e non costituiscono consulenza in materia di investimenti per questa piattaforma. La piattaforma non garantisce l’accuratezza, la completezza e la tempestività delle informazioni relative all’articolo, né è responsabile delle perdite causate dall’uso o dall’affidamento delle informazioni relative all’articolo.
WikiFX Trader
D prime
Supervisione del paese
EC markets
Sotto supervisione
VT Markets
Sotto supervisione
AVATRADE
Sotto supervisione
HFM
Sotto supervisione
EBC
Sotto supervisione
D prime
Supervisione del paese
EC markets
Sotto supervisione
VT Markets
Sotto supervisione
AVATRADE
Sotto supervisione
HFM
Sotto supervisione
EBC
Sotto supervisione
Rate Calc
USD

CNY
Tasso di cambio attuale:0
inserisci l'importo
USD
A disposizione
CNY
Calcolare