
Applicazione di richiesta di informazioni sulla regolamentazione dei broker globali
WikiFX
English
简体中文
繁體中文
English
Pусский
日本語
ภาษาไทย
Tiếng Việt
Bahasa Indonesia
Español
हिन्दी
Filippiiniläinen
Français
Deutsch
Português
Türkçe
한국어
العربية
FPG XAUUSD Market Report October 21, 2025
Sommario:Gold appears to have experienced price rejection at 4381, followed by a slight correction to 4346. The current price is around 4370 and remains actively fluctuating within a tight range. The 4381 leve
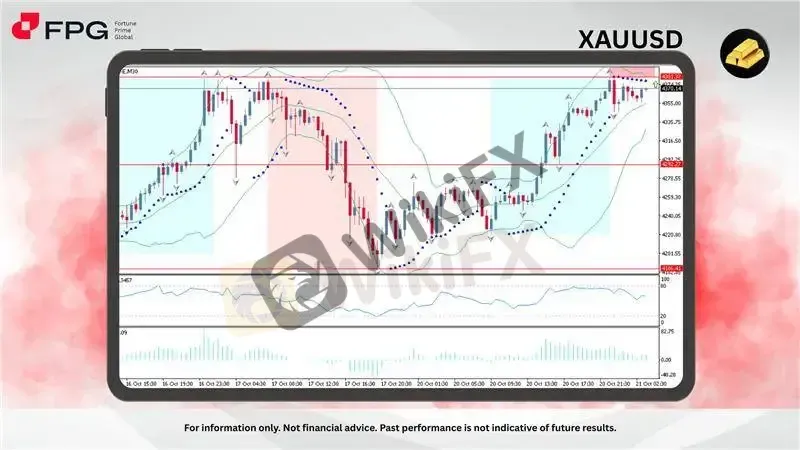
Gold appears to have experienced price rejection at 4381, followed by a slight correction to 4346. The current price is around 4370 and remains actively fluctuating within a tight range. The 4381 level marks the most recent all-time high, only marginally above the previous 4380, but still represents a strong resistance zone both technically and psychologically. Price movements show that buyers remain in control, though short-term consolidation may occur before another potential breakout attempt.
The chart shows consistent upward movement supported by the Parabolic SAR dots below price action, signaling continued bullish momentum. The Bollinger Bands are moderately expanding, suggesting potential volatility ahead. The MFI (Money Flow Index) stands around 59, indicating a balanced flow between buyers and sellers, but still leaning toward bullish territory. Meanwhile, the Bulls Power indicator remains positive, confirming sustained buying strength despite short-term pullbacks.
From a macroeconomic standpoint, gold remains influenced by ongoing uncertainty surrounding the US Federal Reserve‘s monetary policy, as traders await further clarity on potential rate cuts. Tensions in the Middle East and cautious sentiment regarding China’s economic outlook continue to drive safe-haven demand for gold. Unless stronger signals of US economic recovery or policy tightening emerge, golds bullish bias is expected to stay intact in the near term.
Market Observation & Strategy Advice
1. Current Position: Gold is trading around 4370, just below its recent all-time high at 4381. The price remains in an overall bullish structure, though minor corrections are visible after repeated rejections at the upper resistance zone.
2. Resistance Zone: The key resistance is located between 4375 – 4385, marking the upper limit of the current bullish channel and the most recent historical high. A confirmed breakout above this zone could trigger another wave of bullish momentum.
3. Support Zone: Immediate support lies around 4340 – 4320, followed by stronger structural support near 4290 – 4280, which previously acted as a consolidation base before the last breakout. A sustained drop below these levels could signal short-term weakness.
4. Indicators: Technical indicators show mixed but generally bullish momentum. The Parabolic SAR dots remain below price action, suggesting ongoing upward pressure. Bollinger Bands are widening, indicating renewed volatility. The MFI is around 59, reflecting healthy buying interest but not yet overbought, while Bulls Power continues to hold positive territory, confirming that buyers are still dominating.
5. Trading Strategy Suggestions:
Buy on dips: Buy near the 4340 – 4320 zone, with a short-term target around 4380 – 4390 if bullish momentum resumes.
Wait for confirmation: Wait above 4385 before entering new long positions targeting 4410 – 4425, using tight stop-loss levels to manage volatility.
Avoid over-leverage: Be cautious if the price remains choppy below 4380, as sideways movement may occur before the next directional breakout.
Market Performance:
Precious Metals Last Price % Change
XPTUSD 1,642.40 +0.74%
XAGUSD 52.5130 +0.26%
Today's Key Economic Calendar:
AU: RBA Jones Speech
JP: BoJ Himino Speech
EU: ECB President Lagarde Speech
CA: Core Inflation Rate YoY
CA: Inflation Rate MoM & YoY
US: Fed Waller Speech
Risk Disclaimer This report is for informational purposes only and does not constitute financial advice. Investments involve risks, and past performance does not guarantee future results. Consult your financial advisor for personalized investment strategies.
Disclaimer:
Le opinioni di questo articolo rappresentano solo le opinioni personali dell’autore e non costituiscono consulenza in materia di investimenti per questa piattaforma. La piattaforma non garantisce l’accuratezza, la completezza e la tempestività delle informazioni relative all’articolo, né è responsabile delle perdite causate dall’uso o dall’affidamento delle informazioni relative all’articolo.
WikiFX Trader
WikiFX Trader
Rate Calc
USD

CNY
Tasso di cambio attuale:0
inserisci l'importo
USD
A disposizione
CNY
Calcolare