
Applicazione di richiesta di informazioni sulla regolamentazione dei broker globali
WikiFX
English
简体中文
繁體中文
English
Pусский
日本語
ภาษาไทย
Tiếng Việt
Bahasa Indonesia
Español
हिन्दी
Filippiiniläinen
Français
Deutsch
Português
Türkçe
한국어
العربية
The Market Always Finds a Reason to Fall — Gold Crashes Below $4,000
Sommario:Volatility has surged across all major asset classes — equities, bonds, currencies, and precious metals — echoing the asset-rotation risk we warned about earlier. Gold tumbled from a record high of $4
Volatility has surged across all major asset classes — equities, bonds, currencies, and precious metals — echoing the asset-rotation risk we warned about earlier. Gold tumbled from a record high of $4,379/oz to below $4,000, losing nearly 10% in just three trading days. This sharp decline suggests that the metals long-standing bull run may be giving way to a structural correction driven by profit-taking pressure.
Why is gold facing a structural decline rather than a normal bull-market pullback?
In the wake of the AI-driven infrastructure investment boom, both the U.S. cloud-service giants (the four major CSPs) and investors chasing returns are focusing on discounted future cash flows.
Although AI has yet to generate meaningful revenue, the industry remains in its capital-expenditure phase (2023–2026). Failing to invest aggressively risks losing competitive ground, forcing companies to continually ramp up spending to secure their place in the AI race.
According to the October U.S. Bank FMS Fund Manager Survey, the market currently exhibits a “buypolar” condition — investors fear missing out on rallies (FOMO) even as they worry about downside risk. Fund managers continue to add risk-asset exposure while shorting the U.S. dollar as a hedge against currency risk, and theyre rotating toward defensive, bond-like sectors such as utilities.
Misallocation of capital has inflated precious metals beyond fundamentals
Since April, the precious-metals market has entered a “mad bull” phase. Gold soared from $3,120/oz to $4,379/oz, gaining more than $1,200. Initially, the rally was justified by tariff-related inflation fears, but time has proven that tariffs had only a limited impact on price levels. Instead, the narrative shifted toward de-dollarization, which we believe is a misplaced justification for the metals surge.
From a broader perspective, the recent rally reflects irrational capital allocation rather than sustainable fundamentals. The arguments supporting higher gold prices remain weak, making the latest three-day correction both inevitable and healthy.
Gold‘s long-term value remains, but watch the business-cycle stage
Gold delivered exceptional returns through 2023–2024, but during economic upcycles — when inflation stabilizes and monetary policy tightens — gold tends to underperform due to rising real interest rates. Historically, across the past three productivity cycles, gold’s returns were relatively weak during such phases.
However, over the past three years, gold has decoupled from U.S. real yields, a rare and unexpected development.
The weak-dollar argument is flawed
The dominant narrative supporting a weaker U.S. dollar rests on America‘s large fiscal deficit and debt-driven GDP growth — effectively a leveraged expansion. When leverage remains within a healthy range, debt financing can enhance returns (higher beta). Under Trump’s “Big and Beautiful” stimulus framework, market sentiment favoring a weaker dollar is understandable.
Yet paradoxically, the same debt problem has now turned rate-cut expectations into the key argument for both a weaker dollar and stronger precious metals — a logic we find somewhat amusing.
If the dollar truly enters a deeper downtrend and gold resumes its bull market, it likely signals a recession scenario. But if risk assets simultaneously hit new highs, then the market has clearly misread something fundamental.
Technical Analysis of Gold
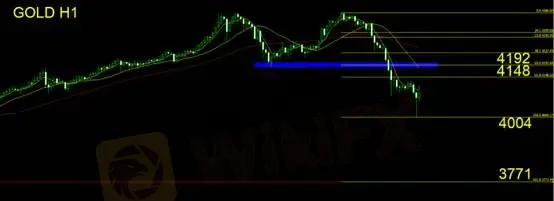
On the hourly chart, gold has formed a clear M-top pattern. Our daily commentary has tracked the left peak, neckline, and double-top formation. A break below the neckline confirms a trend reversal, and traders should continue to adopt a bearish bias rather than a long-side view.
Short-term bears may consider locking in profits after such a steep drop, as a price rebound (mean reversion) is likely. The neckline resistance sits at $4,192, which also aligns with the 50% Fibonacci retracement level — a key zone to watch for potential short re-entries if prices fail to break through.
Stop-loss: $40
Support: $4,004 / $3,771
Resistance: $4,148 / $4,192
Risk Disclaimer
The above opinions, analyses, research, and price levels are provided for general market commentary only and do not represent the stance of this platform. All users should assess their own risk tolerance before trading.
Disclaimer:
Le opinioni di questo articolo rappresentano solo le opinioni personali dell’autore e non costituiscono consulenza in materia di investimenti per questa piattaforma. La piattaforma non garantisce l’accuratezza, la completezza e la tempestività delle informazioni relative all’articolo, né è responsabile delle perdite causate dall’uso o dall’affidamento delle informazioni relative all’articolo.
WikiFX Trader
Rate Calc
USD

CNY
Tasso di cambio attuale:0
inserisci l'importo
USD
A disposizione
CNY
Calcolare