
Globale Broker-Regulierungsanfrage-App
WikiFX
Deutsch
简体中文
繁體中文
English
Pусский
日本語
ภาษาไทย
Tiếng Việt
Bahasa Indonesia
Español
हिन्दी
Filippiiniläinen
Français
Deutsch
Português
Türkçe
한국어
العربية
U.S. September CPI Shows Little Change as Markets Price In Rate Cuts
Zusammenfassung:Inflation data offered reassurance that price pressures continue to ease, reinforcing expectations that the Federal Reserve is on track toward future rate cuts.The U.S. September CPI rose 3.02% year-o
Inflation data offered reassurance that price pressures continue to ease, reinforcing expectations that the Federal Reserve is on track toward future rate cuts.
The U.S. September CPI rose 3.02% year-over-year, while core CPI increased 3.03%. Both figures came in line with market forecasts and showed slower monthly growth, with headline CPI up 0.31% and core CPI up 0.23%. Core inflation has clearly turned a corner: on an annualized basis, the 0.23% monthly increase implies a 2.4%–2.5% yearly pace, down from above 3%. Although the year-over-year core CPI still sits slightly above 3%, the short-term trend now points toward an annualized rate near 2.8%, confirming that inflationary pressures are easing.
This data supports the Fed‘s assessment that inflation is cooling and suggests there’s little cause for concern at this stage.
")
(Chart 1: CPI & Core CPI — Source: U.S. Bureau of Labor Statistics)
From a month-over-month perspective, both CPI and Core CPI showed slower growth. Prices for food, rent, and transportation rose at a slower pace than in August, helping consumers maintain higher disposable income. This offset the impact of rising energy costs, resulting in a healthier overall price balance.
")
(Chart 2: Month-over-Month CPI Change — Source: M Square)
According to CNBC‘s report “Here’s Where the Economy Is Starting to Show ‘K-Shaped’ Bifurcation”, the U.S. economy is experiencing a K-shaped divergence, where affluent consumers maintain strong purchasing power while lower-income households are cutting back.
Coca-Cola CEO James Quincey noted on CNBC‘s “Squawk on the Street” that premium products such as Topo Chico sparkling water and Fairlife protein shakes, which are favored by higher-income consumers, are driving the company’s sales growth.
McDonalds CEO Chris Kempczinski added that while the company continues to perform well among higher-income diners, lower- and middle-income customers are showing a “completely different” trend. He said last month, “Traffic from lower-income consumers has fallen by double digits — people are either skipping meals or eating at home instead.”
From the retail supply-side perspective, companies appear reluctant to raise prices amid weakening consumer demand. With end-market consumption softening, firms face a dilemma — unable to pass on higher costs through price hikes, yet under pressure from declining sales that erode profit margins.
Overall, the latest CPI report suggests a healthy inflation environment without signs of overheating or rapid decline. This allows the Fed to pursue more targeted policy adjustments amid a bifurcated consumer landscape. However, corporate earnings momentum may gradually slow, as the lagging effects of monetary policy continue to weigh on the economy.
Given that equity valuations remain elevated, investors should watch for potential profit-taking pressure following recent market rallies.
Currently, there appears to be limited incentive for safe-haven flows into gold. With rate cuts unlikely to dramatically alter inflation trends, theres little fundamental support for a sustained gold rally.
Gold Technical Analysis
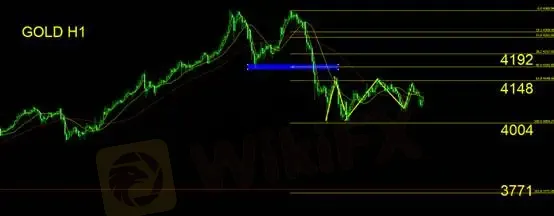
On the hourly chart, gold has formed a double-top (M-shaped) pattern, consolidating below the neckline. The weekly chart confirms a bearish reversal, with a solid red candle and a bearish “mother-and-child” formation, signaling a potential turning point.
As long as prices fail to break above the $4,148 resistance, gold remains in a weak consolidation phase. Traders may consider short positions on rebounds, with downside momentum likely to accelerate if prices fall below $4,004.
Suggested stop loss: $25
Support: $4,004 / $3,771
Resistance: $4,148 / $4,192
Risk Disclaimer: The above analysis, commentary, and data are provided for general market information only and do not represent the views of this platform. All trading involves risk—please operate with caution.
Haftungsausschluss:
Die Ansichten in diesem Artikel stellen nur die persönlichen Ansichten des Autors dar und stellen keine Anlageberatung der Plattform dar. Diese Plattform übernimmt keine Garantie für die Richtigkeit, Vollständigkeit und Aktualität der Artikelinformationen und haftet auch nicht für Verluste, die durch die Nutzung oder das Vertrauen der Artikelinformationen verursacht werden.
WikiFX-Broker
Aktuelle Nachrichten
Die Top 3 am besten regulierten Forex-Broker weltweit
 WikiFX
Ethereum-Gebühren stürzen ab – JPMorgan warnt vor Strohfeuer
WikiFXMacrons Sonnenbrille aus Davos lässt die Aktie dieses kleinen italienischen Herstellers explodieren
WikiFXXRP hält die Linie – diese Signale geben Ripple-Anlegern jetzt Hoffnung
WikiFXKrypto-Boom voraus? Circle-Chef rechnet mit 40 Prozent Wachstum pro Jahr
WikiFXWechselkursberechnung
USD

CNY
Aktueller Wechselkurs:0
Bitte geben Sie den Betrag ein
USD
Konvertierbarer Betrag
CNY
Berechnen