World Cup Fever Is Here! Choose your broker like you choose your team
Join WikiFX and investors worldwide in celebrating the excitement of the 2026 FIFA World Cup!
Original
简体中文
繁體中文
English
Pусский
日本語
ภาษาไทย
Tiếng Việt
Bahasa Indonesia
Español
हिन्दी
Filippiiniläinen
Français
Deutsch
Português
Türkçe
한국어
العربية
اردو

Abstract:Powered by WikiFX: (DXY, S&P, Nasdaq) Technical Analysis July 14 , 2023
CONFIRMATION OF INFLATION HITTING THE US DOLLAR HARD, LIFTING EQUITIES
The May inflation print revealed that core inflation had fallen below the previous sticky range of 5.4% - 5.7% for the first time, printing at 5.3%. However, it appears that markets have received more confirmation of the US disinflationary trend when June's core CPI data came in below the consensus forecast of 5%, eventually coming in at 4.8%. The headline measure, as well as the PPI, which was released ahead of the US open today, have been trending lower for some time.

TECHNICAL LEVELS IN THE S&P 500 TO CONSIDER
The S&P 500 (E-mini futures chart) suggests a higher open today, with the flagship US index poised to test resistance near 4528 (the 78.6% retracement of the 2022 major decline) and 4550. Pullbacks in the index have been difficult to come by, but prices have ended lower in two separate weeks. Bullish momentum accelerated after the declines, as bulls saw better entry points to resume the upward trend.

As prices edged higher yesterday only to close below 4510, the daily chart can help identify the new yearly high. Today, the futures market sees 4550 as the next level of resistance, with 4585 and 4630 following. Given the steady increase, support levels have become difficult to identify, but the swing low of 4411 is the most important level to monitor. For those expecting pullbacks soon, the RSI is just inches away from re-entering overbought territory.
The NASDAQ 100 index INTEREST LEVELS IN TECHNOLOGY

The Nasdaq, which has led the US equities race this year, is approaching a complete retracement of the major 2022 decline. What's more impressive is that this run has occurred during a year in which interest rates have continued to rise, albeit at a slower pace, thanks to a handful of megacap stocks and AI players.
The market appears motivated to reclaim all of the lost ground in 2022, as evidenced by a move above 15,260 and the 78.6% Fibonacci retracement of the 2022 decline. Weekly momentum appears to be strong, having remained overbought since the end of May. As long as prices stay within the ascending channel, the uptrend will continue.
On the daily chart, the move above what would have been considered a double top if prices had not rallied higher is clear. The September level of 15,710 is the next level of resistance, with 16,260 indicating near-term bullish fatigue. The index is on the verge of becoming overbought ahead of next week's start of tech earnings, which will be led by Tesla and Netflix after the major banks.


Disclaimer:
The views in this article only represent the author's personal views, and do not constitute investment advice on this platform. This platform does not guarantee the accuracy, completeness and timeliness of the information in the article, and will not be liable for any loss caused by the use of or reliance on the information in the article.

Join WikiFX and investors worldwide in celebrating the excitement of the 2026 FIFA World Cup!
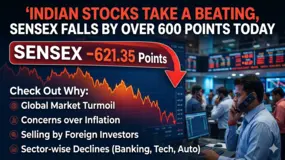
Indian stock markets witnessed a sharp low in the early trading hours on Monday. While the Sensex fell by more than 600 points, Nifty slumped under 23,200. The fall in the stock market today is the investors’ reaction to the escalating tensions in the Middle East, a surge in crude oil prices and weakness across markets worldwide. At around 9:30 a.m. on June 8, 2026, the BSE Sensex dropped by 627.47 points to 73,615.87, recording a fall of 0.85%. At the same time, the Nifty declined by 195.40 points to 23,171.30, registering a 0.84% fall. The selloff was broad based, with most sectoral indices slipping into red. Nifty IT, Nifty Realty, Nifty Auto and Nifty Metal slipped by 1.61%, 1.68%, 1.21% and 1.31%, respectively. Even the Nifty Midcap 100 and Nifty Smallcap 100 declined by 0.73% and 0.63%, respectively. As far as Sensex stocks are concerned, only State Bank of India, Axis Bank, Power Grid Corporation of India and Sun Pharmaceutical Industries were found to be green. Among the one
Have you experienced issues with Pepperstone deposit & withdrawal processing? From your experience, do you feel that the Australia-based forex broker causes losses to its clients? Did the brokerage entity freeze your account and give you a margin call? All these trading allegations have been rampant on broker review platforms such as WikiFX. This Pepperstone review article takes a close look at the user complaints, especially in 2026. Additionally, we have given an overview of the regulatory framework under which the brokerage entity operates.

Some broker comparisons end with a confident "go with this one." This is not one of them — and that honesty is exactly what makes it worth reading. Wundersys and tradgrip are two young, offshore-registered brokers that keep popping up in front of beginner traders, often through aggressive online marketing. Both promise the usual buffet: tight spreads, generous leverage, multiple account tiers. And both, according to WikiFX, sit near the very bottom of the safety scale. So instead of crowning a champion, this comparison is really about something more useful: learning to read the warning signs, understanding the small differences that still matter, and knowing why "the better of two risky options" is still a conversation about risk.
 WikiFXWikiFXWikiFXWikiFXWikiFXWikiFXWikiFXWikiFXWikiFXWikiFX
