
Global Broker Regulation Inquiry App
WikiFX
English
简体中文
繁體中文
English
Pусский
日本語
ภาษาไทย
Tiếng Việt
Bahasa Indonesia
Español
हिन्दी
Filippiiniläinen
Français
Deutsch
Português
Türkçe
한국어
العربية
FPG XAUUSD Market Report September 11, 2025
Abstract:Gold (XAUUSD) has entered a consolidation phase after reaching several all-time highs, with price action now moving within a clearly defined range. The upper boundary near 3674 continues to act as str
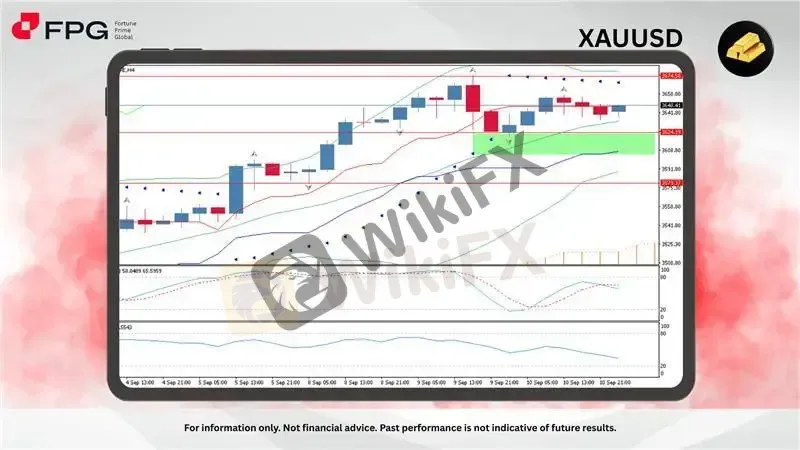
Gold (XAUUSD) has entered a consolidation phase after reaching several all-time highs, with price action now moving within a clearly defined range. The upper boundary near 3674 continues to act as strong resistance, while the lower side around 3624 provides a supportive base. This sideways movement reflects a temporary balance between buyers and sellers, as the market digests the recent rally.
Momentum indicators show a mixed picture. The Stochastic Oscillator (5,3,3) is hovering in mid-levels around 58, suggesting indecision and limited momentum in either direction. Meanwhile, the Money Flow Index (MFI 14) has slipped toward the 34 level, signaling that buying pressure has cooled, and there may be reduced inflows into gold at this stage. The narrowing Bollinger Bands reinforce this view of lower volatility during the consolidation.
Overall, the technical outlook suggests a ranging market unless a breakout occurs. A sustained move above 3674 would likely reignite bullish momentum and open the path to fresh highs, while a breakdown below 3624 could expose gold to deeper retracements toward 3579. For now, traders may favor range strategies, buying dips near support and selling rallies near resistance, while staying alert for breakout signals that could set the next directional move.
Market Observation & Strategy Advice
1. Current Position: Gold is consolidating within a sideways channel after its recent highs, trading between 3624–3674. Price action shows indecision, with candles clustering near mid-range (3640s).
2. Resistance Zone: The upper boundary at 3674 acts as a strong resistance. A breakout above this level may trigger renewed bullish momentum.
3. Support Zone: The immediate support lies at 3624, with stronger support seen at 3579. Failure to hold above these levels could lead to deeper corrections.
4. Indicators: Bollinger Bands: Narrowing, suggesting reduced volatility and potential breakout setup. Stochastic Oscillator (5,3,3): At 58, reflecting neutral momentum and no strong directional bias. MFI (14): At 34, signaling weakening inflows and slightly bearish bias if pressure persists. Parabolic SAR: Dots above price candles suggest current short-term pressure is tilting bearish.
5. Trading Strategy Suggestions:
Buy Scenario: Consider long entries if price breaks and sustains above 3674, targeting 3700–3725, with stop-loss below 3655.
Sell Scenario: Short positions can be considered if price breaks below 3624, targeting 3600–3579, with stop-loss above 3645.
Range Trading: While price remains between 3624–3674, apply range strategies, buying dips near support and selling near resistance, while monitoring for breakout momentum.
Market Performance:
Precious Metals Last Price % Change
XPTUSD 1,395.38 +0.07%
XAGUSD 41.2046 +0.09%
Today's Key Economic Calendar:
EU: Deposit Facility Rate
EU: ECB Interest Rate Decision
US: Core Inflation Rate MoM & YoY
US: Inflation Rate MoM & YoY
EU: ECB Press Conference
Risk Disclaimer This report is for informational purposes only and does not constitute financial advice. Investments involve risks, and past performance does not guarantee future results. Consult your financial advisor for personalized investment strategies.
Disclaimer:
The views in this article only represent the author's personal views, and do not constitute investment advice on this platform. This platform does not guarantee the accuracy, completeness and timeliness of the information in the article, and will not be liable for any loss caused by the use of or reliance on the information in the article.
WikiFX Broker
Latest News
INTERPOL, AFRIPOL Crack Down on Africa Terror Finance
 WikiFX
Forex Scam Checker Philippines: Verify Brokers with WikiFX
WikiFXMH Markets Review 2025: Trading Platforms, Pros and Cons
WikiFXMekness Review: Traders Report Alleged Fund Scams & Account Blocks
WikiFXOcta FX in Pakistan: The Complete Guide to Local Payments, Regulation, and Support
WikiFXD Prime to Exit Limassol Office Amid Doo Group Restructure
WikiFXWikiFX Elites Club Committee Concludes Voting! Inaugural Lineup Officially Announced
WikiFXFake Trading Platforms Are Spreading Fast Across Asia | How Investors Are Being Tricked
WikiFXeToro CopyTrader Expands to U.S. Investors
WikiFXIs MH Markets Safe or a Scam? Regulation and Fund Security Explained
WikiFXCurrency Calculator
USD

CNY
Current Rate: 0
Amount
USD
Available
CNY
Calculate