
Global Broker Regulation Inquiry App
WikiFX
English
简体中文
繁體中文
English
Pусский
日本語
ภาษาไทย
Tiếng Việt
Bahasa Indonesia
Español
हिन्दी
Filippiiniläinen
Français
Deutsch
Português
Türkçe
한국어
العربية
FOMC Minutes: Policy Dilemma Under Tariff Pressures
Abstract:The September Fund Manager Survey (FMS) shows that managers average cash holdings stayed at 3.9% for the third straight month—below the 4.0% warning line. This reflects ongoing optimism toward equitie
The September Fund Manager Survey (FMS) shows that managers average cash holdings stayed at 3.9% for the third straight month—below the 4.0% warning line. This reflects ongoing optimism toward equities. However, when optimism runs this high, it signals that liquidity is already heavily deployed, leaving little incremental buying power. We caution investors about potential corrections in risk assets.
")
(Chart 1. Cash levels in FMS Fund Manager Survey; Source: BofA)
Currently, the S&P 500 is trading at a forward 12-month P/E of about 22.5x—an undeniably elevated valuation. While high multiples are often overlooked during equity rallies, they represent a key downside risk when sentiment eventually shifts.
")
(Chart 2. Forward 12-Month P/E Ratio; Source: FactSet)
Although FMS managers continue to hold low levels of cash, portfolio allocations have shifted significantly. As shown below, exposure to previously crowded European and UK equities has been reduced in favor of U.S. equities—particularly technology stocks. This helps explain the weaker performance in European markets versus the repeated highs in U.S. equities, underscoring the surveys value as a leading indicator.
")
(Chart 3. Monthly Changes in Fund Manager Portfolio Allocations; Source: BofA)
On an absolute basis, September positioning shows a continued trend from July and August: managers remain underweight (UW) the U.S. dollar, as well as energy stocks, REITs, UK equities, U.S. equities, consumer staples, and discretionary sectors. We believe this persistent underweight stance on dollar assets will eventually reverse, serving as a structural catalyst for renewed dollar strength.
")
(Chart 4. September Absolute Positioning; Source: BofA)
Crowded trades continue to dominate sentiment. The top three identified trades are long “U.S. Magnificent 7,” long gold, and short the dollar. However, short-dollar positioning fell sharply to 14%, while long gold exposure rose compared with the prior two months, and long “Magnificent 7” declined to 42%. Our advice remains: avoid overly crowded trades. Notably, short-dollar sentiment has declined for three consecutive months.
")
(Chart 5. Most Crowded Trades; Source: BofA)
An interesting takeaway: 73% of managers believe AI is deflationary. Most see AI driving efficiency gains and cost reductions, helping to suppress inflation. This outlook justifies higher valuation multiples for tech companies: lower inflation leads to reduced rate pressure, which lowers discount rates and increases the present value of future cash flows. In short, investors are more willing to pay a premium for tech earnings growth in this environment.
")
(Chart 6. Do Fund Managers Believe AI Improves Productivity?; Source: BofA)Gold Technical Analysis
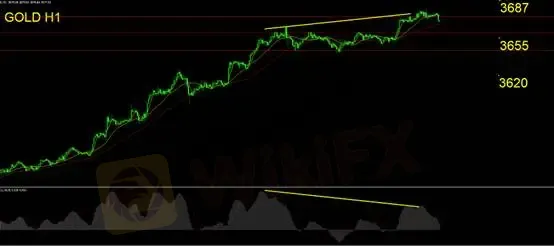
On the hourly chart, MACD divergence with price remains intact. Spot gold has closed above the 5-day moving average for 18 consecutive sessions, but the momentum may be losing steam. Investors should avoid chasing the rally.
From a structural perspective, the final stages of extended liquidity-driven rallies tend to overshoot, increasing the risk of sharp reversals. If a pullback occurs, technicals suggest consolidation between the 3620–3655 range.
Support: 3655 / 3620
Resistance: 3687
Aggressive traders may look for short entries on rebounds, while conservative investors should wait for confirmation from a daily close below prior support.
Risk Disclaimer: The views, analysis, research, prices, or other information presented here are provided as general market commentary and do not represent the official stance of this platform. All readers are responsible for their own investment decisions. Exercise caution.
Disclaimer:
The views in this article only represent the author's personal views, and do not constitute investment advice on this platform. This platform does not guarantee the accuracy, completeness and timeliness of the information in the article, and will not be liable for any loss caused by the use of or reliance on the information in the article.
WikiFX Broker
Latest News
MH Markets Review 2025: Trading Platforms, Pros and Cons
 WikiFX
Octa FX in Pakistan: The Complete Guide to Local Payments, Regulation, and Support
WikiFXMekness Review: Traders Report Alleged Fund Scams & Account Blocks
WikiFXINTERPOL, AFRIPOL Crack Down on Africa Terror Finance
WikiFXForex Scam Checker Philippines: Verify Brokers with WikiFX
WikiFXD Prime to Exit Limassol Office Amid Doo Group Restructure
WikiFXFake Trading Platforms Are Spreading Fast Across Asia | How Investors Are Being Tricked
WikiFXWikiFX Elites Club Committee Concludes Voting! Inaugural Lineup Officially Announced
WikiFXeToro CopyTrader Expands to U.S. Investors
WikiFXIs MH Markets Safe or a Scam? Regulation and Fund Security Explained
WikiFXCurrency Calculator
USD

CNY
Current Rate: 0
Amount
USD
Available
CNY
Calculate