
Global Broker Regulation Inquiry App
WikiFX
English
简体中文
繁體中文
English
Pусский
日本語
ภาษาไทย
Tiếng Việt
Bahasa Indonesia
Español
हिन्दी
Filippiiniläinen
Français
Deutsch
Português
Türkçe
한국어
العربية
FPG AAPL Market Report September 17, 2025
Abstract:Apple (AAPL) remains in a consolidation phase after its recent rally, currently traded around 238.30. Price action has been moving sideways within a defined range, showing repeated rejections near res
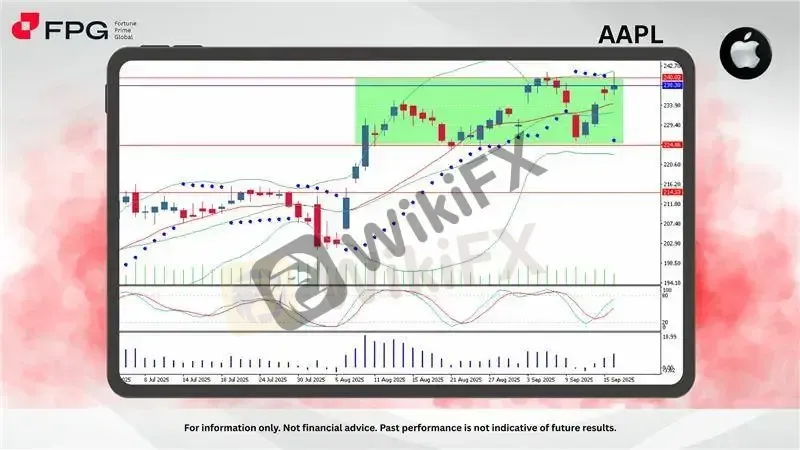
Apple (AAPL) remains in a consolidation phase after its recent rally, currently traded around 238.30. Price action has been moving sideways within a defined range, showing repeated rejections near resistance while holding above key support. The broader trend is still bullish, but short-term structure suggests indecision with momentum fading.
The daily chart highlights consolidation between 224.86 support and 240.03 resistance, with price clustering in the upper band of the range. Recent candles show wicks on both ends, reflecting strong tug-of-war between buyers and sellers. The 20-day moving average is trending upward, acting as a dynamic support within the consolidation zone.
Indicators are mixed: Stochastic Oscillator (5,3,3) is at 74, nearing overbought levels but not yet signaling exhaustion. Bulls Power stands at 7.43, indicating moderate buying pressure. Parabolic SAR dots remain below the candles, maintaining a bullish bias. However, Bollinger Bands suggest volatility compression, pointing to a potential breakout setup.
Market Observation & Strategy Advice
1. Current position: AAPL is consolidating after a strong upward push, trading near 238.30 within a sideways channel. Candles are clustering close to the resistance area, reflecting caution among buyers.
2. Resistance Zone: 240.03 is the key resistance level. A breakout above this may unlock further bullish continuation toward new highs.
3. Support Zone: The immediate support lies at 224.86. A breakdown below this level could expose deeper corrections toward 214.33.
4. Indicators: Bollinger Bands: Contracting, signaling potential volatility breakout. Stochastic Oscillator (5,3,3): At 74, showing upward momentum but close to overbought territory. Bulls Power: At 7.43, reflecting moderate bullish pressure. Parabolic SAR: Dots below price candles, maintaining bullish tilt.
5. Trading Strategy Suggestions:
Breakout Buy: Long entries may be considered if AAPL breaks and closes above 240.03, targeting 245–248, with stop-loss below 237.
Support Rebound: Buy on dips near 224.86 if the support holds, aiming for a rebound back toward 238–240.
Cautious Short: If price fails to hold above 224.86, short-term sellers could target 214.33, though broader trend still favors the upside.
Market Performance:
Stocks Last Price % Change
NFLX 1,200.51 −0.15%
TSLA 421.62 +2.82%
Today's Key Economic Calendar:
JP: Balance of Trade
UK: Inflation Rate YoY
US: Building Permits Prel
US: Housing Starts
CA: BoC Interest Rate Decision
Risk Disclaimer This report is for informational purposes only and does not constitute financial advice. Investments involve risks, and past performance does not guarantee future results. Consult your financial advisor for personalized investment strategies.
Disclaimer:
The views in this article only represent the author's personal views, and do not constitute investment advice on this platform. This platform does not guarantee the accuracy, completeness and timeliness of the information in the article, and will not be liable for any loss caused by the use of or reliance on the information in the article.
WikiFX Broker
Latest News
INTERPOL, AFRIPOL Crack Down on Africa Terror Finance
 WikiFX
Forex Scam Checker Philippines: Verify Brokers with WikiFX
WikiFXMH Markets Review 2025: Trading Platforms, Pros and Cons
WikiFXMekness Review: Traders Report Alleged Fund Scams & Account Blocks
WikiFXOcta FX in Pakistan: The Complete Guide to Local Payments, Regulation, and Support
WikiFXD Prime to Exit Limassol Office Amid Doo Group Restructure
WikiFXWikiFX Elites Club Committee Concludes Voting! Inaugural Lineup Officially Announced
WikiFXFake Trading Platforms Are Spreading Fast Across Asia | How Investors Are Being Tricked
WikiFXeToro CopyTrader Expands to U.S. Investors
WikiFXIs MH Markets Safe or a Scam? Regulation and Fund Security Explained
WikiFXCurrency Calculator
USD

CNY
Current Rate: 0
Amount
USD
Available
CNY
Calculate