
Global Broker Regulation Inquiry App
WikiFX
English
简体中文
繁體中文
English
Pусский
日本語
ภาษาไทย
Tiếng Việt
Bahasa Indonesia
Español
हिन्दी
Filippiiniläinen
Français
Deutsch
Português
Türkçe
한국어
العربية
FPG USDJPY Market Report November 10, 2025
Abstract:USDJPY traded around 153.77, rebounding from last weeks low near 152.80 as the dollar regained traction amid firmer U.S. yields. The pair extended its intraday recovery after breaking the 50% Fibonacc
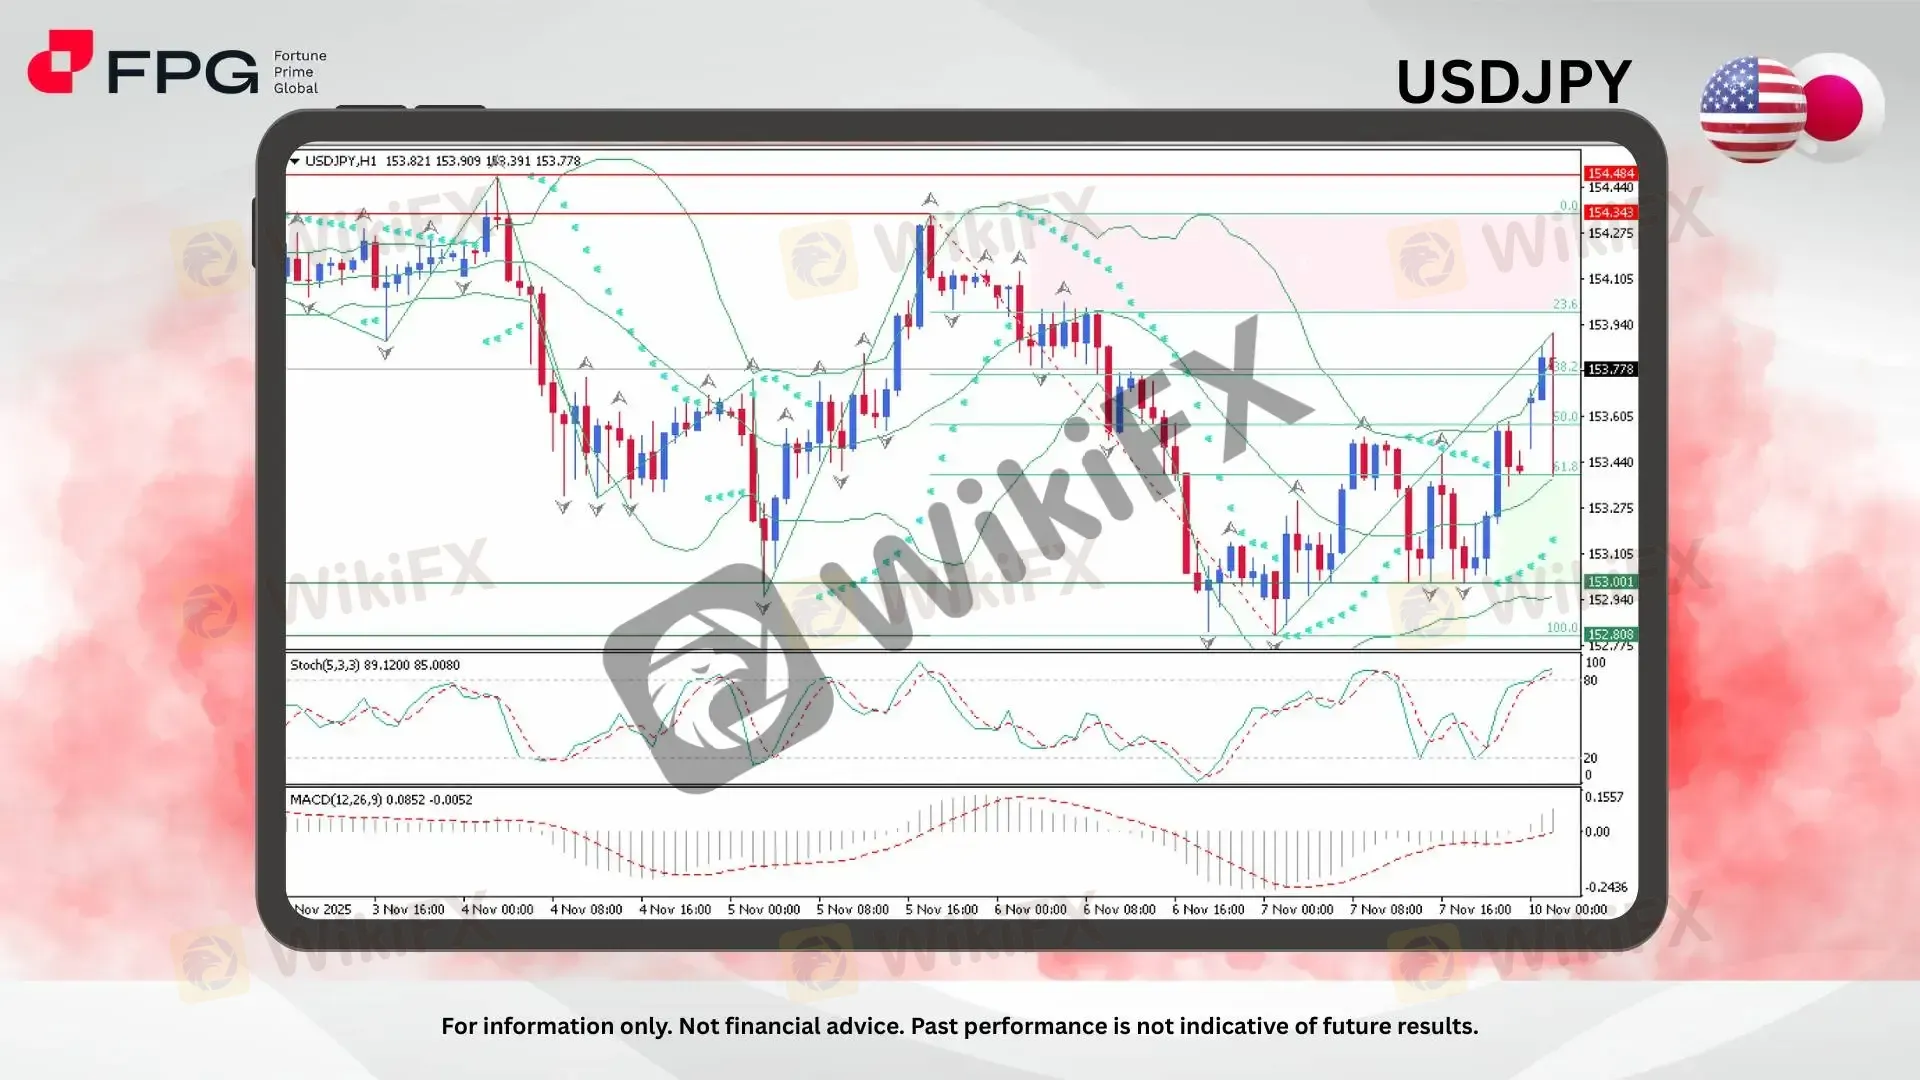
USDJPY traded around 153.77, rebounding from last weeks low near 152.80 as the dollar regained traction amid firmer U.S. yields. The pair extended its intraday recovery after breaking the 50% Fibonacci retracement level, signaling renewed bullish momentum. However, upside movement remains capped below the 154.34–154.48 resistance zone, keeping short-term traders cautious about potential pullbacks within the range-bound structure.
From a structural view, USDJPY continues to oscillate within a corrective range but shows strengthening momentum as prices approach the upper Bollinger Band. The pair has broken the 38.2% and 50% Fibonacci retracement zones, suggesting buyers are regaining short-term control. The Parabolic SAR dots have flipped below the candles, reinforcing the current bullish bias, though the upper Bollinger Band near 153.94 poses a near-term hurdle.
Momentum indicators confirm the recovery phase but also hint at an overheated market. The Stochastic Oscillator (5,3,3) stands high at 89.12 and 85.00, entering overbought territory and warning of possible exhaustion. Meanwhile, the MACD (12,26,9) shows a positive histogram and a bullish crossover, supporting continued upside in the near term before a potential corrective pullback.
Market Observation & Strategy Advice
1. Current Position: USDJPY traded around 153.77, showing bullish continuation after reclaiming the mid-range zone.
2. Resistance Zone: The key resistance sits at 154.34–154.48, aligning with the upper Bollinger Band and previous swing highs.
3. Support Zone: Immediate support lies at 153.00, followed by a stronger base at 152.80, marking the recent local low.
4 Indicators: Stochastic indicates overbought conditions, while MACD supports short-term bullish momentum.The bias remains mildly bullish toward 154.30–154.50, but overbought signals suggest a possible retracement back to 153.20–153.00 if price fails to sustain above 153.80.
5. Trading Strategy Suggestions:
Buy on Dips: Consider long positions near 153.20–153.00 targeting 154.30–154.40, with stops below 152.80.
Sell Near Resistance: Short positions can be considered around 154.40, targeting 153.30–153.00 if reversal signals appear.
Risk Management: Tighten stops on both sides as volatility may increase with U.S. inflation data releases later this week.
Market Performance:
Forex Last Price % Change
EUR/USD 1.1555 −0.05%
GBP/USD 1.3146 −0.12%
Today's Key Economic Calendar:
JP: BoJ Summary of Opinions
JP: BoJ Nakagawa Speech
CA: BoC Market Participants Survey
Risk Disclaimer: This report is for informational purposes only and does not constitute financial advice. Investments involve risks, and past performance does not guarantee future results. Consult your financial advisor for personalized investment strategies.
Disclaimer:
The views in this article only represent the author's personal views, and do not constitute investment advice on this platform. This platform does not guarantee the accuracy, completeness and timeliness of the information in the article, and will not be liable for any loss caused by the use of or reliance on the information in the article.
WikiFX Broker
Latest News
ECB Minutes: Service Inflation and Wage Spikes Kill Rate Cut Speculation
 WikiFX
Trade War Averted: Euro Rallies as US Withdraws Tariff Threats
WikiFXYen Volatility Spikes: PM Takaichi Calls Snap Election Amid BoJ 'Hawkish Pause'
WikiFXSticky US Inflation Data Dashes Near-Term Fed Rate Cut Hopes
WikiFXYen Fragility Persists: Inflation Miss Cements BoJ 'Hold' Expectation
WikiFXBoJ "Politically Paralyzed" at 0.75% as Takaichi Calls Snap Election
WikiFX'Bond Vigilantes' Return: JGB Rout Sparks Contagion Fears for US Treasuries
WikiFXZarVista User Reputation: Looking at Real User Reviews to Check Is ZarVista Safe or Scam?
WikiFXGold Fun Corporation Ltd Review 2025: Is This Forex Broker Safe?
WikiFXMONAXA Review: Safety, Regulation & Forex Trading Details
WikiFXCurrency Calculator
USD

CNY
Current Rate:0
Amount
USD
Available
CNY
Calculate