
Global Broker Regulation Inquiry App
WikiFX
English
简体中文
繁體中文
English
Pусский
日本語
ภาษาไทย
Tiếng Việt
Bahasa Indonesia
Español
हिन्दी
Filippiiniläinen
Français
Deutsch
Português
Türkçe
한국어
العربية
FPG EURUSD Market Report November 14, 2025
Abstract:EURUSD on the H4 timeframe chart, a clear V-shape pattern can be seen, dropped from 1.1657 and rebounded at 1.1466, then rallied bullishly back to 1.1657. The current price is floating around 1.1630,
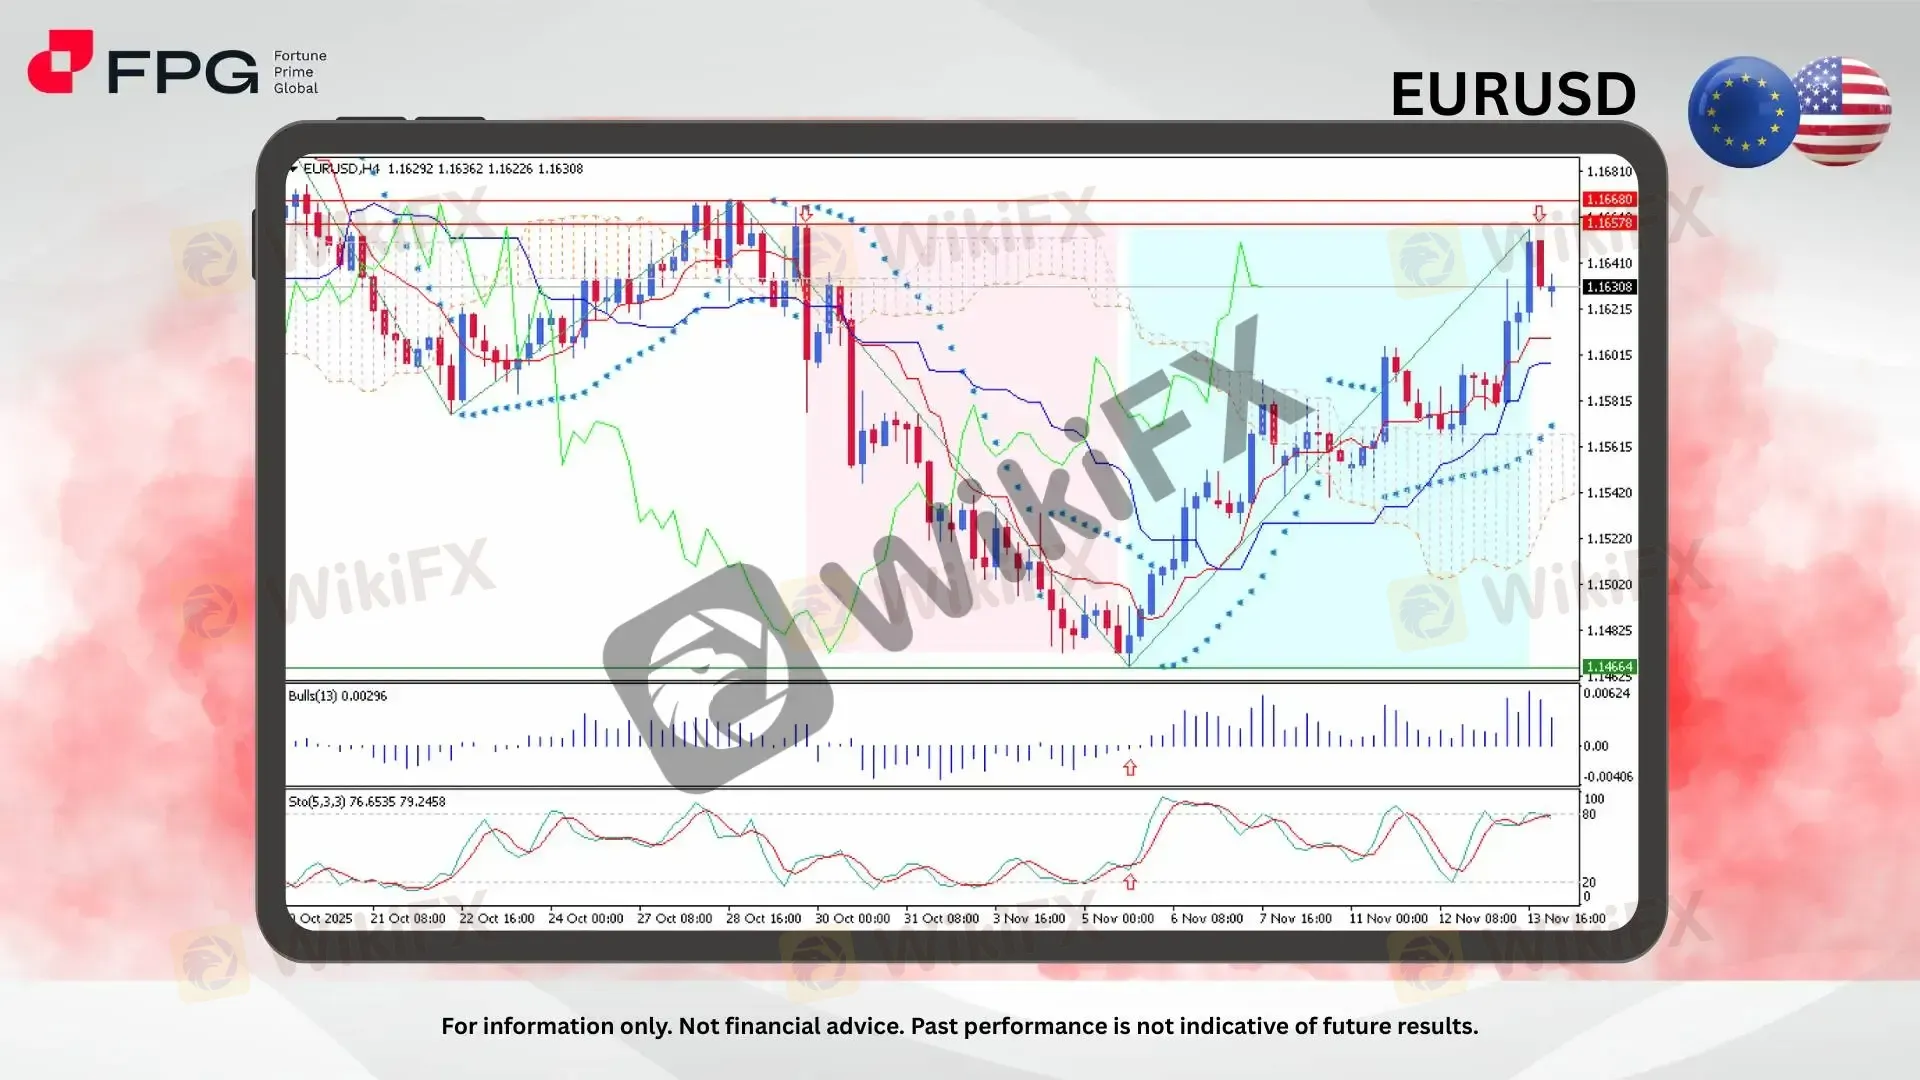
EURUSD on the H4 timeframe chart, a clear V-shape pattern can be seen, dropped from 1.1657 and rebounded at 1.1466, then rallied bullishly back to 1.1657. The current price is floating around 1.1630, maintaining upward traction after a strong recovery phase. Price is still supported by an ascending short-term trendline, signaling that bullish momentum remains intact despite the pair pulling slightly away from the recent highs.
EURUSD continues to trade above the Kijun-sen and Tenkan-sen lines, reinforcing short-term bullish control. The latest rally broke above the Ichimoku cloud before stabilizing just under the major resistance at 1.1657–1.1668, an area that has repeatedly triggered pullbacks. The Parabolic SAR remains positioned below the candles, indicating that upward pressure is still present, although the slope of the trendline suggests momentum is beginning to cool.
From an indicator perspective, Bulls Power is positive, showing steady buying interest, while the Stochastic Oscillator (5,3,3) is hovering around 76.65 / 79.24, placing the pair in upper territory but not yet giving a clear reversal signal. Combined with the recent impulsive breakout from the cloud, EURUSD still carries continuation potential, provided it stays above nearby support zones. Keep an eye on todays key economic events, especially those that have a direct impact on major pairs.
Market Observation & Strategy Advice
1. Current Position: EURUSD is trading around 1.1630, extending its recovery from 1.1466. Price remains above the ascending trendline, showing bullish momentum is still dominant despite hesitation near the higher boundary.
2. Resistance Zone: Immediate resistance stands at 1.1657–1.1668, a critical reaction zone. A successful breakout above this range could open the path toward 1.1720, and further toward 1.1800 if bullish momentum strengthens.
3. Support Zone: Key support lies at 1.1600, followed by 1.1550 and 1.1500. Holding above these zones is essential to maintain the current bullish structure; a break below may invite broader corrective pressure.
4. Indicators: Ichimoku shows the price holding above the cloud, reflecting bullish bias. Parabolic SAR remains below the candles, confirming upward traction. Stochastic Oscillator stays in upper levels, signaling potential continuation, while Bulls Power remains positive, showing ongoing buying strength.
5. Trading Strategy Suggestions:
Buy on Pullbacks: Long positions can be considered near 1.1600–1.1585, targeting 1.1668 and 1.1720, with stops below 1.1550.
Breakout Play: A clean break above 1.1668 may open momentum buys targeting 1.1720–1.1800.
Risk Management: Utilize trailing stops as EURUSD approaches resistance, considering potential reversals from overbought momentum.
Market Performance:
Forex Last Price % Change
USD/JPY 154.68 +0.11%
GBP/USD 1.3139 −0.39%
Today's Key Economic Calendar:
US: Fed Musalem and Hammack Speech
AU: RBA McPhee Speech
CN: Industrial Production YoY
CN: Retail Sales YoY
EU: Balance of Trade
EU: Employment Change QoQ & YoY Prel
US: PPI MoM
US: Retail Sales MoM
Risk Disclaimer: This report is for informational purposes only and does not constitute financial advice. Investments involve risks, and past performance does not guarantee future results. Consult your financial advisor for personalized investment strategies.
Disclaimer:
The views in this article only represent the author's personal views, and do not constitute investment advice on this platform. This platform does not guarantee the accuracy, completeness and timeliness of the information in the article, and will not be liable for any loss caused by the use of or reliance on the information in the article.
WikiFX Broker
Latest News
Yen Fragility Persists: Inflation Miss Cements BoJ 'Hold' Expectation
 WikiFX
Trade War Averted: Euro Rallies as US Withdraws Tariff Threats
WikiFXSticky US Inflation Data Dashes Near-Term Fed Rate Cut Hopes
WikiFXYen Volatility Spikes: PM Takaichi Calls Snap Election Amid BoJ 'Hawkish Pause'
WikiFXECB Minutes: Service Inflation and Wage Spikes Kill Rate Cut Speculation
WikiFXBoJ "Politically Paralyzed" at 0.75% as Takaichi Calls Snap Election
WikiFX'Bond Vigilantes' Return: JGB Rout Sparks Contagion Fears for US Treasuries
WikiFXZarVista User Reputation: Looking at Real User Reviews to Check Is ZarVista Safe or Scam?
WikiFXGold Fun Corporation Ltd Review 2025: Is This Forex Broker Safe?
WikiFXMONAXA Review: Safety, Regulation & Forex Trading Details
WikiFXCurrency Calculator
USD

CNY
Current Rate:0
Amount
USD
Available
CNY
Calculate